Ch. 3 - Derivatives
Hass - Thomas' Calculus 15th Edition
Hass15th EditionThomas' CalculusISBN: 9780137616077Non è quello che usi tu?Cambia libro di testo
Capitolo 3, Problema 3.2.36b

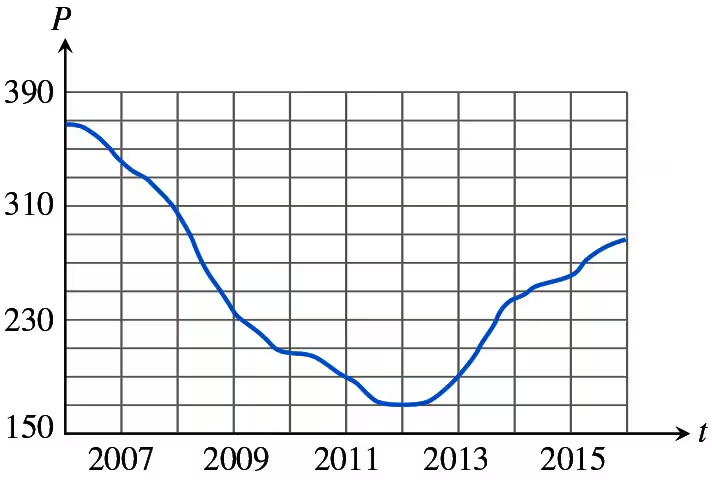
Average single-family home prices P (in thousands of dollars) in Sacramento, California, are shown in the accompanying figure from the beginning of 2006 through the end of 2015.


Graph showing average home prices in Sacramento from 2006 to 2015, with a peak in 2007 and a decline until 2012.


b. Estimate home prices at the end of
i) 2007 ii) 2012 iii) 2015

Guida verificata passo dopo passo
1
To estimate the home prices at the end of 2007, locate the year 2007 on the horizontal axis (t-axis) of the graph. Follow the vertical line upwards until it intersects the curve. From this intersection point, move horizontally to the left to read the corresponding price on the vertical axis (P-axis).
For the year 2012, repeat the process: find 2012 on the t-axis, move vertically to the curve, and then horizontally to the P-axis to estimate the price.
Similarly, for the year 2015, locate 2015 on the t-axis, follow the vertical line to the curve, and then move horizontally to the P-axis to determine the estimated price.
Ensure that you are reading the values accurately by checking the scale of the axes. The vertical axis (P-axis) is marked in increments of 20, starting from 150 up to 390.
Note that these are estimates based on the graph, and the actual values may vary slightly depending on the precision of your reading from the graph.

Risposta video verificata per un problema simile:

Questa soluzione video è stata consigliata dai nostri tutor come utile per risolvere questo problema.
Durata del video:
2m

Concetti chiave

Ecco i concetti essenziali che devi comprendere per rispondere correttamente alla domanda.

Graph Interpretation

Understanding how to read and interpret graphs is crucial in calculus, especially when analyzing trends over time. In this case, the graph shows the average home prices in Sacramento from 2006 to 2015, highlighting key points such as peaks and troughs. Being able to extract numerical values from the graph at specific years is essential for estimating home prices.
Video consigliato:
Percorso guidato
06:15
Graphing The Derivative

Estimation Techniques

Estimation techniques involve using visual data to approximate values that may not be explicitly stated. In this context, students need to estimate home prices at the end of 2007, 2012, and 2015 by analyzing the graph. This skill is important in calculus for making informed predictions based on available data.
Video consigliato:
Percorso guidato
05:59
Estimating the Area Under a Curve with Right Endpoints & Midpoint

Trends and Patterns

Identifying trends and patterns in data is a fundamental concept in calculus and statistics. The graph illustrates a significant peak in home prices in 2007 followed by a decline until 2012, and a gradual recovery thereafter. Recognizing these trends helps in understanding the economic factors influencing home prices over time.
Video consigliato:
Percorso guidato
06:21
Properties of Functions