Ch. 4 - Applications of Derivatives
Hass - Thomas' Calculus 15th Edition
Hass15th EditionThomas' CalculusISBN: 9780137616077Non è quello che usi tu?Cambia libro di testo
Capitolo 4, Problema 36

In Exercises 9–66, graph the function using appropriate methods from the graphing procedures presented just before Example 9, identifying the coordinates of any local extreme points and inflection points. Then find coordinates of absolute extreme points, if any.
36. y = (x³ + x - 2) / (x - x²)

Guida verificata passo dopo passo
1
Step 1: Begin by analyzing the function y = \(\frac{x^3 + x - 2}{x - x^2}\). Identify the domain of the function by determining where the denominator is not zero. Set x - x^2 = 0 and solve for x to find the values that make the denominator zero.
Step 2: Simplify the expression if possible. Factor the denominator x - x^2 as x(1 - x). This helps in understanding the behavior of the function near the points where the denominator is zero.
Step 3: Find the first derivative of the function to identify local extreme points. Use the quotient rule: \(\frac{d}{dx}\[\left\)(\(\frac{u}{v}\]\right\)) = \(\frac{u'v - uv'}{v^2}\), where u = x^3 + x - 2 and v = x - x^2. Calculate u' and v', then apply the quotient rule.
Step 4: Find the second derivative to identify inflection points. Differentiate the first derivative using appropriate rules (product, quotient, or chain rule as needed) to find the second derivative. Set the second derivative equal to zero and solve for x to find potential inflection points.
Step 5: Evaluate the function at critical points found from the first derivative and at endpoints of the domain to find absolute extreme points. Compare these values to determine the absolute maximum and minimum, if they exist.

Risposta video verificata per un problema simile:

Questa soluzione video è stata consigliata dai nostri tutor come utile per risolvere questo problema.
Durata del video:
13m

Concetti chiave

Ecco i concetti essenziali che devi comprendere per rispondere correttamente alla domanda.

Graphing Rational Functions

Graphing rational functions involves understanding the behavior of the function as x approaches certain values, particularly where the denominator equals zero, leading to vertical asymptotes. Additionally, identifying horizontal or oblique asymptotes helps in sketching the overall shape of the graph. Analyzing the function's behavior at these critical points is essential for accurate graphing.
Video consigliato:
Percorso guidato
5:53
Graph of Sine and Cosine Function

Local and Absolute Extrema

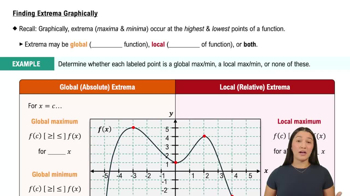
Local extrema refer to points where the function reaches a local maximum or minimum within a certain interval, determined by setting the derivative to zero and analyzing sign changes. Absolute extrema are the highest or lowest points over the entire domain of the function. Identifying these points involves evaluating the function at critical points and endpoints, if applicable.
Video consigliato:
05:58
Finding Extrema Graphically

Inflection Points

Inflection points occur where the function's concavity changes, identified by setting the second derivative to zero and confirming a sign change. These points are crucial for understanding the curvature of the graph, as they indicate transitions between concave up and concave down regions. Recognizing inflection points helps in accurately sketching the graph's shape.
Video consigliato:
04:50
Critical Points