 Indietro
Graphing Linear Equations and Inequalities in Two Variables: Study Notes
Guida di studio - Note intelligenti
 Appunti personalizzati basati sui tuoi materiali, ampliati con definizioni chiave, esempi e contesto.
Linear Equations and Inequalities in Two Variables
The Rectangular Coordinate System
The rectangular coordinate system (also known as the Cartesian plane) is a fundamental tool in algebra for visualizing relationships between two variables. It consists of two perpendicular number lines: the x-axis (horizontal) and the y-axis (vertical), which intersect at the origin (0, 0). The axes divide the plane into four regions called quadrants.
Quadrant I: Both x and y are positive.
Quadrant II: x is negative, y is positive.
Quadrant III: Both x and y are negative.
Quadrant IV: x is positive, y is negative.
Each point in the system is represented by an ordered pair (x, y), where the order is crucial: x-coordinate first, y-coordinate second.
Plotting Ordered Pairs
To plot a point (x, y): move x units along the x-axis, then y units parallel to the y-axis. For example:
A (–2, 4): 2 units left, 4 units up
B (4, –2): 4 units right, 2 units down
C (–3, 0): 3 units left, no movement up/down
D (0, –3): No movement left/right, 3 units down
Finding Coordinates of Points
To determine the coordinates of a point, identify its position relative to the axes. The x-coordinate is the horizontal distance from the origin, and the y-coordinate is the vertical distance.
Solutions of Equations in Two Variables
A solution to an equation in two variables (x and y) is an ordered pair that, when substituted into the equation, results in a true statement. For example, for the equation :
(3, –2): Substitute x = 3, y = –2: (True)
(–2, 3): Substitute x = –2, y = 3: (False)
Finding Solutions of an Equation
To find solutions for an equation such as , select values for x and solve for y:
x = –2:
x = –1:
x = 0:
x = 1:
x = 2:
Point-Plotting Method for Graphing Equations
The point-plotting method is a systematic approach to graphing equations in two variables:
Find several ordered pairs that are solutions to the equation.
Plot these points in the rectangular coordinate system.
Connect the points with a straight line (for linear equations) or a smooth curve (for nonlinear equations).
Example: Graphing y = 2x
Choose values for x and solve for y:
x = –2:
x = –1:
x = 0:
x = 1:
x = 2:
Plot these points and connect them with a straight line.
Applications: Mathematical Models
The rectangular coordinate system is essential for visualizing mathematical models. For example, the formula models the percentage of consumers (D) who paid primarily with debit cards n years after 1995.
n = 0:
n = 5:
n = 10:
n = 15:
Years after 1995 (n) | Percentage (D) |
|---|---|
0 | 1 |
5 | 7 |
10 | 15 |
15 | 22 |
To estimate the percentage in 2015:
2015 – 1995 = 20, so n = 20
About 29% of consumers will pay primarily with debit cards in 2015.
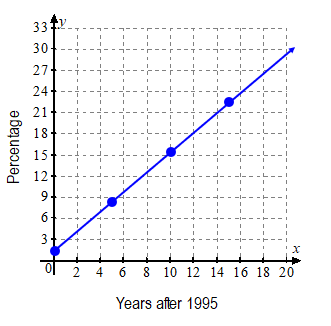
This graph visually represents the linear relationship between years after 1995 and the percentage of consumers using debit cards, reinforcing the concept of linear equations in two variables.
