 Indietro
Linear Equations and Inequalities in Two Variables: Point-Slope Form and Applications
Guida di studio - Note intelligenti
 Appunti personalizzati basati sui tuoi materiali, ampliati con definizioni chiave, esempi e contesto.
Linear Equations and Inequalities in Two Variables
Point-Slope Form of the Equation of a Line
The point-slope form is a fundamental way to express the equation of a nonvertical line in the coordinate plane. It is especially useful when you know the slope of the line and a single point through which the line passes.
Definition: The point-slope form of the equation of a line with slope m passing through the point (x_1, y_1) is given by:
Key Features:
Directly uses the slope and a known point.
Can be rearranged into other forms, such as the slope-intercept form.
Converting to Slope-Intercept Form
The slope-intercept form is another common way to write the equation of a line. It is especially useful for quickly identifying the slope and the y-intercept.
Definition: The slope-intercept form is:
Where m is the slope and b is the y-intercept.
Example 1: Writing the Point-Slope and Slope-Intercept Forms
Problem: Write the point-slope form and the slope-intercept form of the equation of the line with slope 6 that passes through the point (2, –5).
Point-slope form:
Slope-intercept form: Solve for y:
Example 2: Finding the Equation of a Line Given Two Points
Problem: A line passes through the points (–2, –1) and (–1, –6). Find the equation of the line in point-slope form and in slope-intercept form.
Step 1: Find the slope (m):
Step 2: Use the slope and either point in the point-slope form:
Step 3: Convert to slope-intercept form:
Modeling Data with Linear Equations
Linear equations can be used to model real-world data and make predictions. By identifying two data points, you can create a linear model that approximates the relationship between variables.
Example 3: Modeling the Graying of America
The following bar graph shows the median age of the U.S. population for selected years. We can use this data to create a linear model.
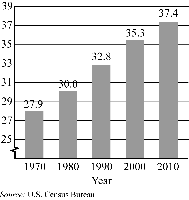
Data Points: (10, 30.0) and (20, 32.8), where x is years after 1970 and y is median age.
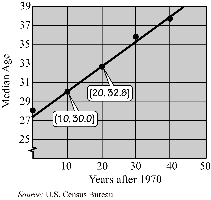
Step 1: Find the slope (m):
Step 2: Write the equation in point-slope form using (10, 30.0):
Step 3: Convert to slope-intercept form:
Step 4: Use the model to predict the median age in 2020 (x = 50):
Interpretation: The model predicts that the median age in 2020 will be 41.2 years.
Summary Table: Forms of Linear Equations
Form | Equation | When to Use |
|---|---|---|
Point-Slope | When you know the slope and a point | |
Slope-Intercept | When you need the y-intercept and slope |
