 Indietro
Parent Functions, Transformations, and Piecewise Functions in College Algebra
Guida di studio - Note intelligenti
 Appunti personalizzati basati sui tuoi materiali, ampliati con definizioni chiave, esempi e contesto.
Parent Functions and Their Graphs
Introduction to Parent Functions
Parent functions are the simplest form of functions in various families, serving as the foundation for more complex functions. Recognizing their graphs and properties is essential for understanding transformations and modeling real-world situations.
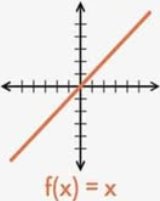
Linear (Identity) Function: The simplest linear function is f(x) = x. Its graph is a straight line passing through the origin with a slope of 1.
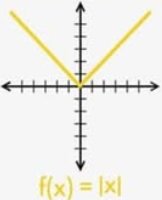
Absolute Value Function: f(x) = |x| forms a 'V' shape, symmetric about the y-axis.
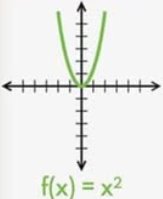
Quadratic Function: f(x) = x^2 is a parabola opening upwards, also symmetric about the y-axis.
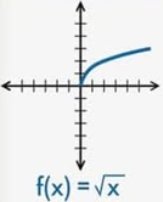
Square Root Function: f(x) = \sqrt{x} starts at the origin and increases slowly, defined only for x ≥ 0.
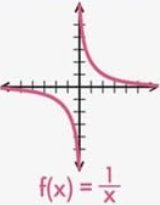
Rational Function: f(x) = \frac{1}{x} has two branches, with vertical and horizontal asymptotes at x = 0 and y = 0, respectively.
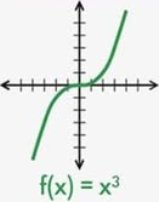
Cubic Function: f(x) = x^3 passes through the origin and is symmetric about it.
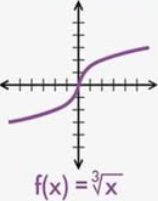
Cube Root Function: f(x) = \sqrt[3]{x} is defined for all real numbers and is also symmetric about the origin.
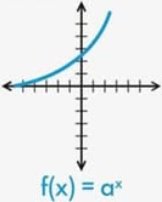
Exponential Function: f(x) = a^x (where a > 0, a ≠ 1) increases rapidly for positive x and approaches zero for negative x.
Example Graphs:
Key Characteristics of Parent Functions
Intercepts: Points where the graph crosses the x-axis (x-intercept) and y-axis (y-intercept).
Domain: The set of all possible input values (x-values) for the function.
Range: The set of all possible output values (y-values) for the function.
Intervals of Increase/Decrease: Where the function values are rising or falling as x increases.
Continuity: Some graphs are continuous (no breaks), while others are discontinuous (have breaks or are defined in pieces).
Transformations of Functions
Types of Transformations
Transformations alter the position or shape of a parent function's graph. The general transformation formula is:
Vertical Shifts: f(x) + k shifts the graph up by k units; f(x) - k shifts it down by k units.
Horizontal Shifts: f(x + h) shifts the graph left by h units; f(x - h) shifts it right by h units.
Vertical Stretch/Compression and Reflection: a \cdot f(x) stretches (|a| > 1) or compresses (0 < |a| < 1) vertically; -a \cdot f(x) reflects over the x-axis.
Horizontal Stretch/Compression and Reflection: f(bx) compresses horizontally if |b| > 1, stretches if 0 < |b| < 1; f(-x) reflects over the y-axis.
Example: For y = 2(x - 2)^2 + 1:
Shift right by 2 units (x - 2)
Vertical stretch by a factor of 2
Shift up by 1 unit (+1)
Example: For y = -4|x - 1| + 1:
Reflect over x-axis (negative sign)
Vertical stretch by 4
Shift right by 1 unit
Shift up by 1 unit
Piecewise Functions
Definition and Graphing
Piecewise functions are defined by different expressions over different intervals of the domain. Their graphs may have breaks or be composed of distinct pieces.
Notation: A piecewise function is written using braces to show different formulas for different intervals.
Graphing: Graph each piece on its specified interval, paying attention to open or closed endpoints.
Example: Sketch the graph of
To evaluate function values, substitute the input into the appropriate piece:
f(-4): Use the first piece (x < -2), so f(-4) = -4.
f(-2): Use the second piece (x = -2), so f(-2) = 3.
f(7): Use the third piece (x > -2), so f(7) = |7| = 7.
Graphical Example of a Piecewise Function
Writing Equations from Graphs
Given a graph, identify the intervals and the corresponding expressions for each piece. For example, if the blue segment is quadratic, it might be y = -\frac{1}{2}x^2 + 18 for a certain interval.
Summary Table: Parent Functions and Their Properties
Function | Equation | Domain | Range | Intercepts | Continuity |
|---|---|---|---|---|---|
Linear | All real numbers | All real numbers | (0,0) | Continuous | |
Absolute Value | All real numbers | (0,0) | Continuous | ||
Quadratic | All real numbers | (0,0) | Continuous | ||
Square Root | (0,0) | Continuous | |||
Rational | None | Discontinuous at x=0 | |||
Cubic | All real numbers | All real numbers | (0,0) | Continuous | |
Cube Root | All real numbers | All real numbers | (0,0) | Continuous | |
Exponential | All real numbers | (0,1) | Continuous |
Practice Problems
Write the equation of a line given a point and slope.
Identify the slope and y-intercept from an equation.
Sketch the graph of a function and identify intercepts, domain, and range.
Apply transformations to parent functions and describe the resulting graph.
Graph and evaluate piecewise functions for given values of x.
