 Indietro
Slope and Its Applications in Linear Equations and Inequalities in Two Variables
Guida di studio - Note intelligenti
 Appunti personalizzati basati sui tuoi materiali, ampliati con definizioni chiave, esempi e contesto.
Linear Equations and Inequalities in Two Variables
Slope: Definition and Calculation
The slope of a line is a measure of its steepness, describing how much the line rises or falls as it moves from left to right. It is calculated as the ratio of the vertical change (rise) to the horizontal change (run) between two distinct points on the line.
Definition: The slope m of the line passing through points and is given by:
Interpretation: A positive slope means the line rises from left to right, a negative slope means it falls, a zero slope indicates a horizontal line, and an undefined slope corresponds to a vertical line.
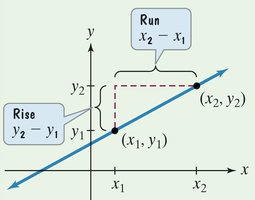
Examples: Calculating Slope
Example 1: Find the slope of the line passing through and .
The slope is negative, so the line falls from left to right.
Example 2a: Find the slope of the line passing through and .
The slope is zero, indicating a horizontal line.
Example 2b: Find the slope of the line passing through and .
(undefined)
The slope is undefined, indicating a vertical line.
Slopes of Parallel and Perpendicular Lines
Understanding the relationship between slopes allows us to determine if lines are parallel or perpendicular.
Parallel Lines
Two nonvertical lines are parallel if and only if they have the same slope: .
Two distinct vertical lines (with undefined slopes) are also parallel.
Example: Showing Lines are Parallel
Find the slopes of the lines through and , and through and :
Since , the lines are parallel.
Perpendicular Lines
Two nonvertical lines are perpendicular if and only if the product of their slopes is : .
A horizontal line (slope $0$) is perpendicular to a vertical line (undefined slope).
Example: Showing Lines are Perpendicular
Find the slopes of the lines through and , and through and :
Since the product is , the lines are perpendicular.
Slope as Rate of Change
The slope of a line can also be interpreted as a rate of change, describing how one variable changes in relation to another. In applied contexts, this is especially useful for interpreting data trends.
Formula:
The rate of change tells how fast is changing with respect to .
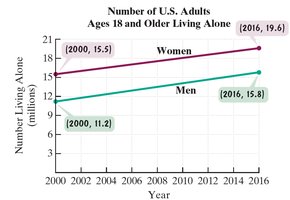
Example: Using the graph, the slope of the line segment for men from 2000 to 2016 is:
This means the number of American men living alone increased at a rate of approximately 0.29 million per year during this period.
