 Indietro
Slope-Intercept Form and Graphing Linear Equations in Two Variables
Guida di studio - Note intelligenti
 Appunti personalizzati basati sui tuoi materiali, ampliati con definizioni chiave, esempi e contesto.
Linear Equations and Inequalities in Two Variables
Slope-Intercept Form of the Equation of a Line
The slope-intercept form is a fundamental way to express the equation of a nonvertical line in algebra. It allows for easy identification of the line's slope and y-intercept, which are essential for graphing and modeling real-world data.
Definition: The slope-intercept form of a line is where m is the slope and b is the y-intercept.
Slope (m): The rate at which the line rises or falls; calculated as the change in y divided by the change in x.
Y-intercept (b): The point where the line crosses the y-axis; represented as (0, b).
Example: For , the slope is 2 and the y-intercept is -7.
Example: For , the slope is and the y-intercept is 4.
Example: For , the slope is -7 and the y-intercept is 6.
Graphing Lines in Slope-Intercept Form
Graphing a line using its slope and y-intercept is a straightforward process that helps visualize linear relationships.
Plot the y-intercept (0, b) on the y-axis.
Use the slope m (rise over run) to find a second point. If m is a fraction, rise = numerator, run = denominator.
Draw a straight line through the two points, extending in both directions.
Example: For , plot (0, -2), then move up 3 units and right 1 unit to plot the second point.
Example: For , plot (0, 1), then move up 3 units and right 5 units.
Graphing Ax + By = C Using Slope and Y-Intercept
Linear equations in the form Ax + By = C can be graphed by converting them to slope-intercept form. This method is efficient and widely used in algebra.
Procedure: Solve for y to rewrite the equation as .
Use the slope and y-intercept to graph as described above.
Example: For , solve for y: The slope is , and the y-intercept is 0.
Plot (0, 0), then move down 3 units and right 4 units for the second point.
Modeling Data with Slope and Y-Intercept
Slope-intercept form is useful for modeling real-world data, such as population statistics. By using two data points, you can create a linear model to predict future values.
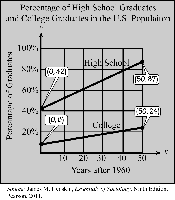
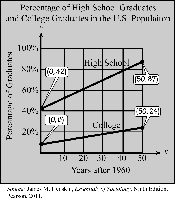
Application Example: Modeling the percentage of college graduates in the U.S. population.
Given two points: (0, 8) and (50, 24), representing years after 1960 and percentage of graduates.
Calculate the slope:
Equation:
Projection: For 2020 (x = 60): Projected percentage of college graduates in 2020 is 27.2%.
Summary Table: Slope-Intercept Form Properties
Form | Slope (m) | Y-intercept (b) | Graphing Steps |
|---|---|---|---|
y = mx + b | Coefficient of x | Constant term | Plot (0, b), use slope to find second point, draw line |
Ax + By = C | -A/B | C/B | Solve for y, then graph as above |
