 Indietro
Systems of Linear Inequalities
Guida di studio - Note intelligenti
 Appunti personalizzati basati sui tuoi materiali, ampliati con definizioni chiave, esempi e contesto.
Systems of Linear Inequalities
Introduction to Systems of Linear Inequalities
Systems of linear inequalities involve two or more inequalities that are considered simultaneously. The solution to such a system is the set of all ordered pairs that satisfy every inequality in the system. These systems are commonly used in mathematical modeling to represent constraints in real-world situations, such as health guidelines, economics, and engineering.
System of Linear Inequalities: A set of two or more linear inequalities with the same variables.
Solution Set: The collection of all ordered pairs that satisfy every inequality in the system.
Graphical Representation: The solution set is represented as the region of overlap (intersection) of the individual solution regions for each inequality.
Mathematical Models Involving Systems of Linear Inequalities
Mathematical models often use systems of linear inequalities to describe feasible regions for variables under certain constraints. For example, health organizations may use such models to define healthy weight ranges for individuals based on height and weight.
Application: Modeling healthy weight regions for adults using inequalities relating height and weight.
Interpretation: Each inequality represents a boundary, and the region between these boundaries is the set of acceptable solutions.
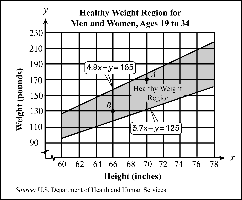
Checking Solutions to a System of Linear Inequalities
To determine if a specific point is a solution to a system of linear inequalities, substitute the coordinates of the point into each inequality. If the point satisfies all inequalities, it is part of the solution set.
Step 1: Substitute the x- and y-values of the point into each inequality.
Step 2: Check if all inequalities are true for the given values.
Conclusion: If all are true, the point is a solution; otherwise, it is not.
Example: Given the system:
Check if the point (66, 130) is a solution:
Substitute into the first inequality:
Substitute into the second inequality:
If both are true, (66, 130) is a solution.
Graphing Systems of Linear Inequalities
Graphing is a visual method for finding the solution set of a system of linear inequalities. Each inequality divides the plane into two regions. The solution set is the region where all shaded areas overlap.
Step 1: Replace each inequality symbol with an equal sign to graph the boundary line.
Step 2: Use a solid line for ≤ or ≥, and a dashed line for < or >.
Step 3: Find the x- and y-intercepts to plot each line.
Step 4: Choose a test point (commonly (0, 0)) to determine which side of the line to shade.
Step 5: The solution set is the region where the shaded areas for all inequalities overlap.
Example: Graph the solution set for the system:
First line (dashed): passes through (4, 0) and (0, 2)
Second line (solid): passes through (–3, 0) and (0, 2)
Test point: (0, 0)
Shade the appropriate regions and identify the overlap.
Summary Table: Steps for Graphing a System of Linear Inequalities
Step | Description |
|---|---|
1 | Graph each boundary line (solid for ≤/≥, dashed for </>) |
2 | Find intercepts to plot lines accurately |
3 | Choose a test point to determine shading |
4 | Shade the solution region for each inequality |
5 | Identify the overlapping region as the solution set |
Additional info:
Systems of linear inequalities are foundational for understanding feasible regions in optimization problems, such as those encountered in linear programming. The graphical approach is especially useful for systems with two variables, as it provides a clear visual representation of all possible solutions.
