Ch. 1 - Equations and Inequalities
Blitzer - College Algebra 8th Edition
Blitzer8th EditionCollege AlgebraISBN: 9780136970514Non è quello che usi tu?Cambia libro di testo
Capitolo 2, Problema 2

Graph each equation in Exercises 1–4. Let x= -3, -2. -1, 0, 1, 2 and 3. y = x^2-3

Guida verificata passo dopo passo
1
Step 1: Understand the problem. The equation y = x^2 - 3 is a quadratic equation, which represents a parabola. We are tasked with graphing this equation by calculating the y-values for specific x-values: -3, -2, -1, 0, 1, 2, and 3.
Step 2: Substitute each x-value into the equation y = x^2 - 3 to calculate the corresponding y-value. For example, when x = -3, substitute -3 into the equation to find y: y = (-3)^2 - 3.
Step 3: Repeat the substitution process for all the given x-values (-3, -2, -1, 0, 1, 2, 3). For each x-value, calculate y by squaring the x-value and then subtracting 3. Record the resulting (x, y) pairs.
Step 4: Plot the calculated (x, y) points on a coordinate plane. For example, if one of the points is (-3, 6), plot this point by moving 3 units to the left on the x-axis and 6 units up on the y-axis.
Step 5: Connect the plotted points with a smooth curve to form the parabola. Ensure the curve opens upwards (since the coefficient of x^2 is positive) and has its vertex at the lowest point of the graph.

Risposta video verificata per un problema simile:

Questa soluzione video è stata consigliata dai nostri tutor come utile per risolvere questo problema.
Durata del video:
3m

Concetti chiave

Ecco i concetti essenziali che devi comprendere per rispondere correttamente alla domanda.

Quadratic Functions

A quadratic function is a polynomial function of degree two, typically expressed in the form y = ax^2 + bx + c. The graph of a quadratic function is a parabola, which can open upwards or downwards depending on the sign of the coefficient 'a'. Understanding the shape and properties of parabolas is essential for graphing quadratic equations.
Video consigliato:
06:36
Solving Quadratic Equations Using The Quadratic Formula

Evaluating Functions

Evaluating a function involves substituting specific values for the variable(s) in the function's equation. In this case, substituting the given x-values (-3, -2, -1, 0, 1, 2, 3) into the equation y = x^2 - 3 allows us to calculate the corresponding y-values. This process is crucial for plotting points on the graph.
Video consigliato:
4:26
Evaluating Composed Functions

Graphing Points

Graphing points involves plotting the calculated (x, y) pairs on a coordinate plane. Each point represents a solution to the equation, and connecting these points helps visualize the function's behavior. Understanding how to accurately plot points and interpret the resulting graph is vital for analyzing the function's characteristics.
Video consigliato:
04:29
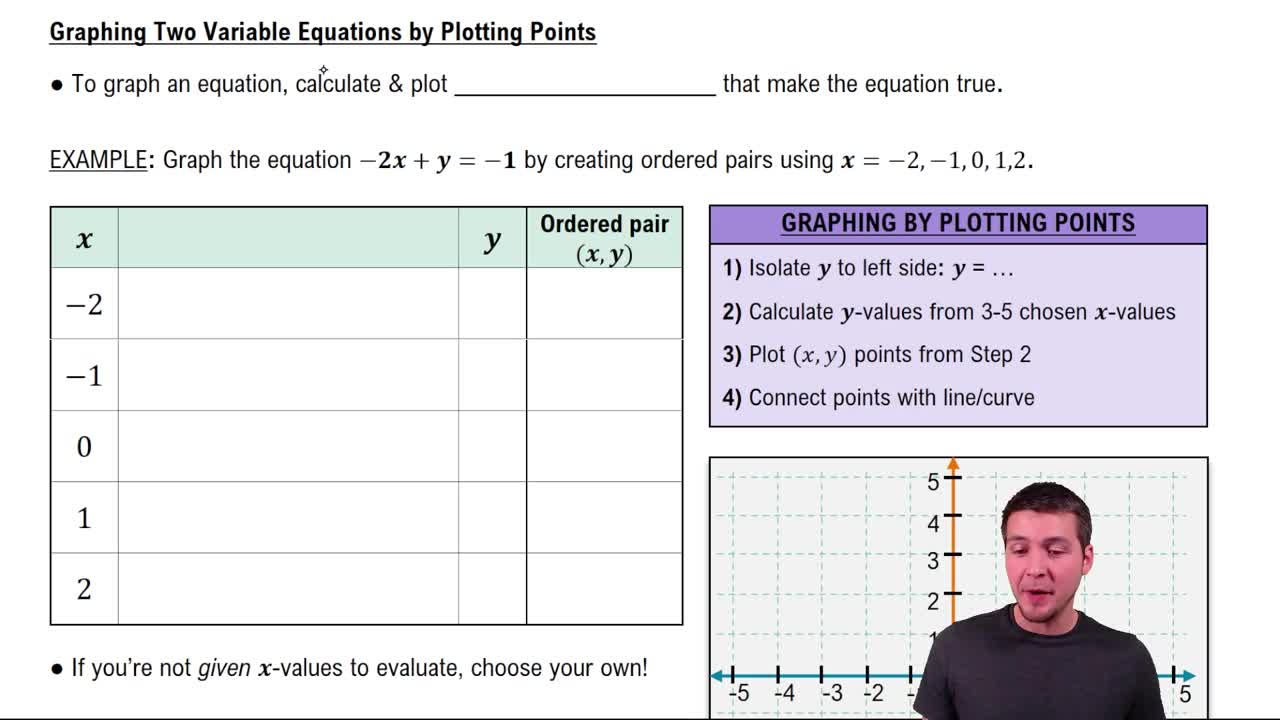
Graphing Equations of Two Variables by Plotting Points