Indietro
Problema 7
In Exercises 1–10, determine whether each relation is a function. Give the domain and range for each relation. {(-3, -3), (-2, −2), (−1, −1), (0, 0)}
Problema 9
In Exercises 1–10, determine whether each relation is a function. Give the domain and range for each relation. {(1, 4), (1, 5), (1, 6)}
Problema 11
In Exercises 11–26, determine whether each equation defines y as a function of x. x + y = 16
Problema 17
In Exercises 11–26, determine whether each equation defines y as a function of x. x = y²
Problema 20
Determine whether each equation defines y as a function of x.
Problema 24
In Exercises 11–26, determine whether each equation defines y as a function of x. xy - 5y =1
Problema 25
In Exercises 11–26, determine whether each equation defines y as a function of x. |x| − y = 2
Problema 33a
Evaluate each function at the given values of the independent variable and simplify.
Problema 33c
Evaluate each function at the given values of the independent variable and simplify.
Problema 39
Graph the given functions, f and g, in the same rectangular coordinate system. Select integers for x, starting with -2 and ending with 2. Once you have obtained your graphs, describe how the graph of g is related to the graph of f. f(x) = x, g(x) = x + 3
Problema 41
Graph the given functions, f and g, in the same rectangular coordinate system. Select integers for x, starting with -2 and ending with 2. Once you have obtained your graphs, describe how the graph of g is related to the graph of f. f(x) = -2x, g(x) = -2x-1
Problema 45
Graph the given functions, f and g, in the same rectangular coordinate system. Select integers for x, starting with -2 and ending with 2. Once you have obtained your graphs, describe how the graph of g is related to the graph of f. f(x) = |x|, g(x) = |x| − 2
Problema 46
In Exercises 39–50, graph the given functions, f and g, in the same rectangular coordinate system. Select integers for x, starting with -2 and ending with 2. Once you have obtained your graphs, describe how the graph of g is related to the graph of f. f(x)= |x|, g(x) = |x| +1
Problema 54
In Exercises 51–54, graph the given square root functions, f and g, in the same rectangular coordinate system. Use the integer values of x given to the right of each function to obtain ordered pairs. Because only nonnegative numbers have square roots that are real numbers, be sure that each graph appears only for values of x that cause the expression under the radical sign to be greater than or equal to zero. Once you have obtained your graphs, describe how the graph of g is related to the graph of f. f(x) = √x (x = 0, 1, 4, 9) and g (x) = √(x + 2) (x = = −2, −1, 2, 7)
Problema 55
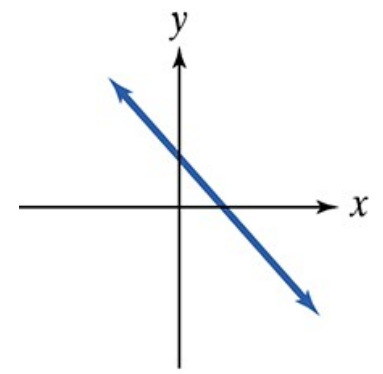
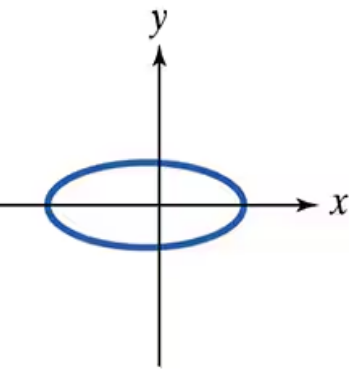
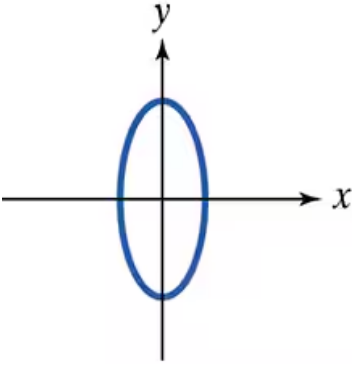
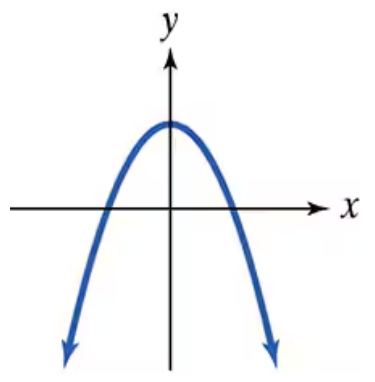
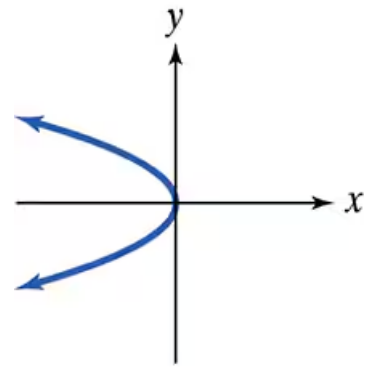
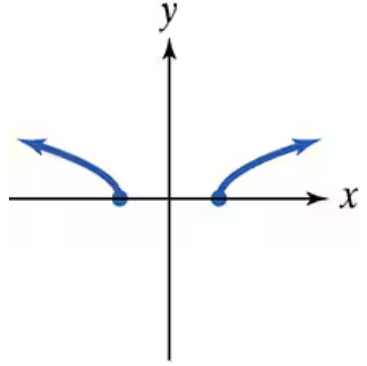
Use the vertical line test to identify graphs in which y is a function of x.
Problema 59
Use the vertical line test to identify graphs in which y is a function of x.
Problema 60
In Exercises 55–64, use the vertical line test to identify graphs in which y is a function of x.
Problema 61
Use the vertical line test to identify graphs in which y is a function of x.
Problema 62
Use the vertical line test to identify graphs in which y is a function of x.
Problema 63
Use the vertical line test to identify graphs in which y is a function of x.
Problema 65
Use the graph of f to find each indicated function value.
f(-2)
Problema 67
In Exercises 65–70, use the graph of f to find each indicated function value. f(4)
Problema 69
In Exercises 65–70, use the graph of f to find each indicated function value. f(-3)
Problema 71
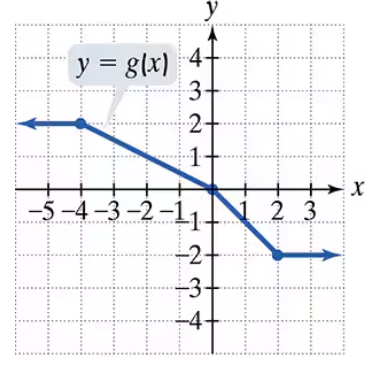
Use the graph of g to solve Exercises 71–76.
Find g(-4)
Problema 72
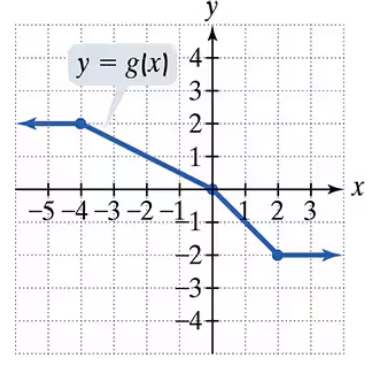
Use the graph of g to solve Exercises 71–76.
Find g(2)
Problema 75
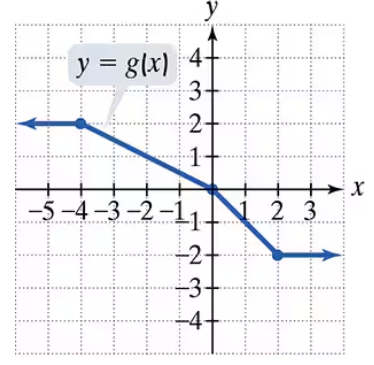
Use the graph of g to solve Exercises 71–76.
For what value of x is g(x) = 1?
Problema 76
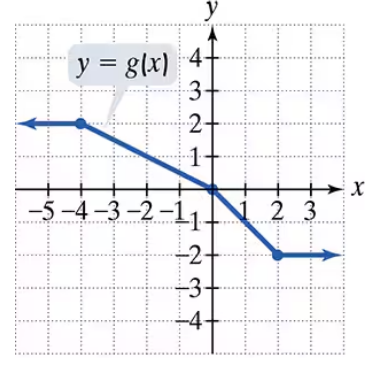
Use the graph of g to solve Exercises 71–76.
For what value of x is g(x) = -1?
Problema 77
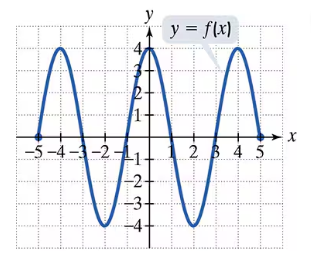
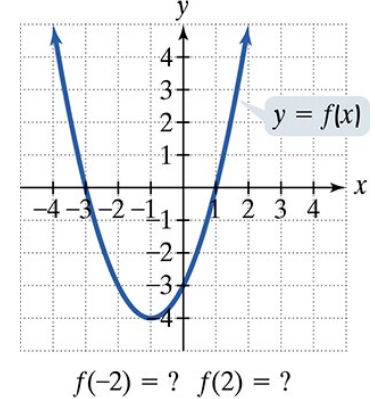
Use the graph to determine a.the x-intercepts, if any; b. the y-intercept, if any; and e. the missing function values, indicated by question marks, below each graph.
Problema 78
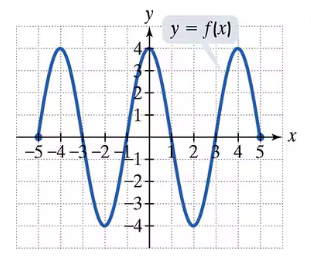
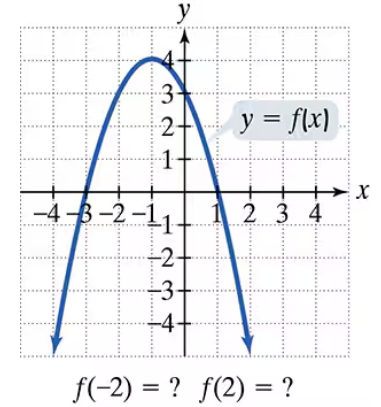
Use the graph to determine a.the x-intercepts, if any; b. the y-intercept, if any; and e. the missing function values, indicated by question marks, below each graph.
Problema 79
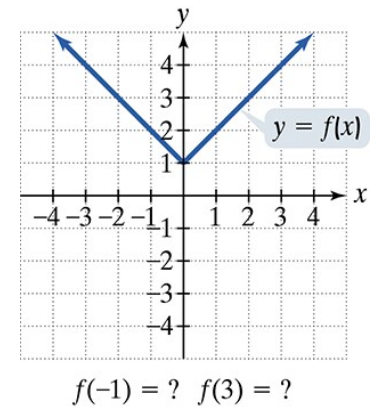
Use the graph to determine a.the x-intercepts, if any; b. the y-intercept, if any; and e. the missing function values, indicated by question marks, below each graph.