Ch. 1 - Equations and Inequalities
Blitzer - College Algebra 8th Edition
Blitzer8th EditionCollege AlgebraISBN: 9780136970514Non è quello che usi tu?Cambia libro di testo
Capitolo 2, Problema 41a

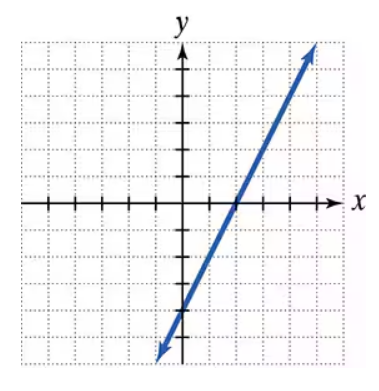
Use the graph to a. determine the x-intercepts, if any; b. determine the y-intercepts, if any. For each graph, tick marks along the axes represent one unit each.

Guida verificata passo dopo passo
1
Step 1: Observe the graph and identify the x-intercept. The x-intercept is the point where the graph crosses the x-axis. From the graph, the orange line crosses the x-axis at x = -5. This means the x-intercept is (-5, 0).
Step 2: Observe the graph and identify the y-intercept. The y-intercept is the point where the graph crosses the y-axis. From the graph, the orange line crosses the y-axis at y = 5. This means the y-intercept is (0, 5).
Step 3: Understand the significance of intercepts. The x-intercept represents the value of x when y = 0, and the y-intercept represents the value of y when x = 0. These points are useful for understanding the behavior of the graph.
Step 4: Verify the intercepts by checking the tick marks along the axes. Each tick mark represents one unit, so the x-intercept at (-5, 0) and the y-intercept at (0, 5) are consistent with the graph.
Step 5: Use the intercepts to write the equation of the line if needed. The slope can be calculated using the formula m = (change in y) / (change in x). From the graph, the slope is m = (5 - 0) / (0 - (-5)) = 5/5 = 1. The equation of the line can be written as y = mx + b, where m is the slope and b is the y-intercept.

Risposta video verificata per un problema simile:

Questa soluzione video è stata consigliata dai nostri tutor come utile per risolvere questo problema.
Durata del video:
59s

Concetti chiave

Ecco i concetti essenziali che devi comprendere per rispondere correttamente alla domanda.

X-Intercept

The x-intercept of a graph is the point where the graph crosses the x-axis. At this point, the value of y is zero. To find the x-intercept, you can set the equation of the line to zero and solve for x. In the provided graph, the x-intercept is located at (-5, 0).
Video consigliato:
04:08
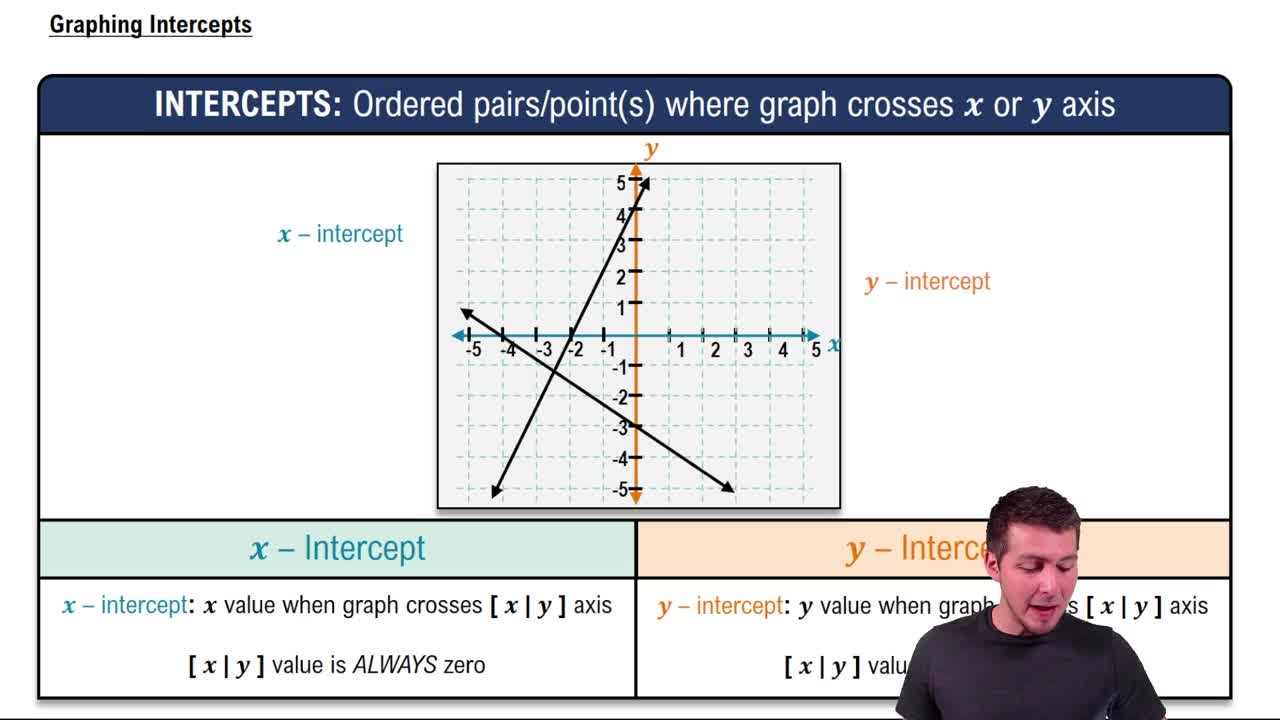
Graphing Intercepts

Y-Intercept

The y-intercept of a graph is the point where the graph crosses the y-axis. At this point, the value of x is zero. To determine the y-intercept, you set the equation of the line to zero and solve for y. In the given graph, the y-intercept is at (0, 5).
Video consigliato:
04:08
Graphing Intercepts

Graph Interpretation

Interpreting a graph involves understanding the relationship between the x and y coordinates represented visually. This includes identifying key features such as intercepts, slopes, and the overall shape of the graph. In this case, recognizing the intercepts helps in analyzing the behavior of the linear function depicted in the graph.
Video consigliato:
02:16
Graphs and Coordinates - Example