In Exercises 1–10, determine whether each relation is a function. Give the domain and range for each relation. {(-3, -3), (-2, −2), (−1, −1), (0, 0)}
Ch. 2 - Functions and Graphs

Capitolo 3, Problema 7
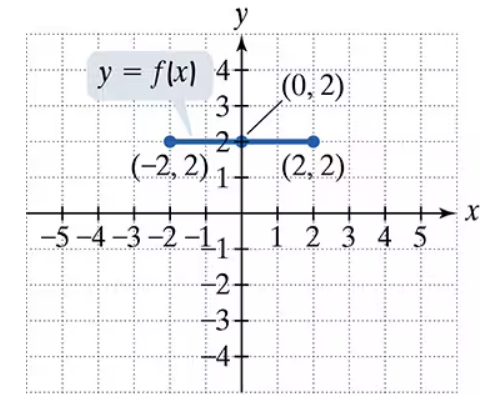
Use the graph of y = f(x) to graph each function g.

g(x) = f(-x)
Guida verificata passo dopo passo1
Step 1: Understand the transformation g(x) = f(-x). This transformation reflects the graph of f(x) across the y-axis. For every point (x, y) on the graph of f(x), the corresponding point on g(x) will be (-x, y).
Step 2: Identify the key points on the graph of f(x). From the image, the graph of f(x) is a horizontal line segment from (1, -3) to (4, -3).
Step 3: Apply the reflection transformation to each key point. Reflect (1, -3) across the y-axis to get (-1, -3). Reflect (4, -3) across the y-axis to get (-4, -3).
Step 4: Draw the new graph of g(x). The graph of g(x) will be a horizontal line segment from (-4, -3) to (-1, -3), maintaining the same y-value of -3.
Step 5: Verify the transformation by checking that the graph of g(x) is symmetric to the graph of f(x) with respect to the y-axis.

Risposta video verificata per un problema simile:
Questa soluzione video è stata consigliata dai nostri tutor come utile per risolvere questo problema.
Durata del video:
1mConcetti chiave
Ecco i concetti essenziali che devi comprendere per rispondere correttamente alla domanda.
Function Reflection
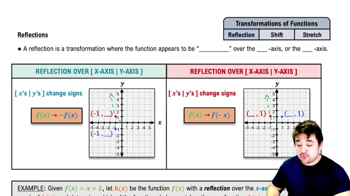
Function reflection involves flipping a graph over a specific axis. For the function g(x) = f(-x), the graph of f(x) is reflected over the y-axis. This means that for every point (a, b) on the graph of f(x), there will be a corresponding point (-a, b) on the graph of g(x). Understanding this concept is crucial for accurately graphing the transformed function.
Video consigliato:
Reflections of Functions
Graphing Horizontal Lines
The graph of a horizontal line, such as y = f(x) in this case, indicates that the output value (y) remains constant across a range of input values (x). In the provided graph, y = f(x) is a horizontal line at y = -3 from x = 1 to x = 4. Recognizing this characteristic helps in visualizing how the graph will change when applying transformations like reflection.
Video consigliato:
Graphing Lines in Slope-Intercept Form
Domain and Range
The domain of a function refers to all possible input values (x-values), while the range refers to all possible output values (y-values). For the function f(x) shown in the graph, the domain is [1, 4] and the range is {-3}. When reflecting the function to create g(x) = f(-x), it is important to consider how the domain and range will change, particularly how the x-values will be affected by the reflection.
Video consigliato:
Domain & Range of Transformed Functions
Pratica correlata
Domanda del libro di testo
249
views
Domanda del libro di testo
Use the given conditions to write an equation for each line in point-slope form and slope-intercept form. Passing through (2, −3) and perpendicular to the line whose equation is y = (1/5)x + 6
81
views
Domanda del libro di testo
In Exercises 1–10, determine whether each relation is a function. Give the domain and range for each relation. {(1, 4), (1, 5), (1, 6)}
142
views
Domanda del libro di testo
Find f(g(x)) and g (f(x)) and determine whether each pair of functions ƒ and g are inverses of each other. f(x) = 3/(x-4) and g(x) = (3/x) + 4
680
views
Domanda del libro di testo
Find the domain of each function. g(x) = 3/(x2-2x-15)
1708
views
Domanda del libro di testo
Evaluate each function at the given values of the independent variable and simplify. g(x) = 3x^2 - 5x + 2 (a) g(0), (b) g(-2), (c) g(x-1), (d) g(-x)
207
views