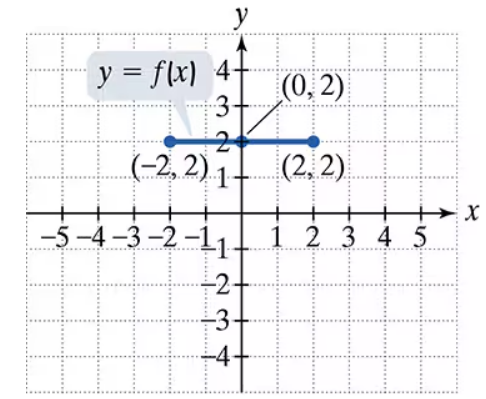
Evaluate each function at the given values of the independent variable and simplify. (a) f(-2), (b) f(1), (c) f(2)
Ch. 2 - Functions and Graphs

Capitolo 3, Problema 11
Use the graph of y = f(x) to graph each function g.

g(x) = ½ f(x)
Guida verificata passo dopo passo1
Step 1: Observe the graph of y = f(x). It is a horizontal line segment from (1, -3) to (4, -3). This means that the function f(x) has a constant value of -3 for all x in the interval [1, 4].
Step 2: The new function g(x) = ½ f(x) involves scaling the values of f(x) by a factor of ½. Since f(x) = -3, g(x) = ½ * (-3) = -3/2 for all x in the interval [1, 4].
Step 3: To graph g(x), keep the x-values the same (from 1 to 4), but adjust the y-values to reflect the scaled value of -3/2. This means the new graph will be a horizontal line segment at y = -3/2.
Step 4: Plot the points (1, -3/2) and (4, -3/2) on the graph. These points represent the endpoints of the horizontal line segment for g(x).
Step 5: Draw a horizontal line segment connecting the points (1, -3/2) and (4, -3/2). This is the graph of g(x) = ½ f(x).

Risposta video verificata per un problema simile:
Questa soluzione video è stata consigliata dai nostri tutor come utile per risolvere questo problema.
Durata del video:
1mConcetti chiave
Ecco i concetti essenziali che devi comprendere per rispondere correttamente alla domanda.
Function Transformation
Function transformation refers to the process of altering the graph of a function through operations such as scaling, translating, or reflecting. In this case, the function g(x) = ½ f(x) represents a vertical compression of the function f(x) by a factor of ½, meaning that all y-values of f(x) are halved, resulting in a graph that is closer to the x-axis.
Video consigliato:
Domain & Range of Transformed Functions
Graphing Linear Functions
Graphing linear functions involves plotting points that satisfy the function's equation and connecting them to form a straight line. For the function f(x) shown in the graph, which is a horizontal line at y = -3 between x = 1 and x = 4, understanding how to plot these points is essential for accurately representing the transformed function g(x).
Video consigliato:
Graphs of Logarithmic Functions
Horizontal and Vertical Scaling
Horizontal and vertical scaling are techniques used to stretch or compress the graph of a function. Vertical scaling, as seen in g(x) = ½ f(x), compresses the graph vertically, affecting the y-values while keeping the x-values unchanged. This concept is crucial for predicting how the graph of g will appear compared to f.
Video consigliato:
Horizontal Parabolas
Pratica correlata
Domanda del libro di testo
114
views
Domanda del libro di testo
Find f(g(x)) and g (f(x)) and determine whether each pair of functions ƒ and g are inverses of each other. f(x) = ∛(x − 4) and g(x) = x³ +4
609
views
Domanda del libro di testo
Use the graph of y = f(x) to graph each function g.
g(x) = f(-x)+3
1044
views
Domanda del libro di testo
The functions in Exercises 11-28 are all one-to-one. For each function, a. Find an equation for f-1(x), the inverse function. b. Verify that your equation is correct by showing that f(ƒ-1 (x)) = = x and ƒ-1 (f(x)) = x. f(x) = x +3
635
views
Domanda del libro di testo
Find the distance between each pair of points. If necessary, express answers in simplified radical form and then round to two decimal places. (3.5, 8.2) and (-0.5, 6.2)
831
views
Domanda del libro di testo
Use the given conditions to write an equation for each line in point-slope form and slope-intercept form. Slope = 2, passing through (3, 5)
86
views