Use the given conditions to write an equation for each line in point-slope form and slope-intercept form. Slope = - 3/5, passing through (10, −4)
Ch. 2 - Functions and Graphs

Capitolo 3, Problema 24
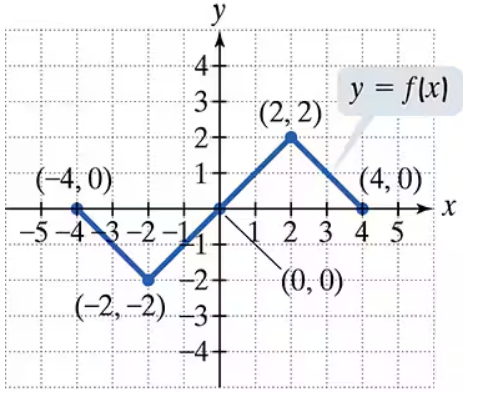
Use the graph of y = f(x) to graph each function g. g(x) = f(-x)

Guida verificata passo dopo passo1
Step 1: Understand the transformation represented by g(x) = f(-x). This transformation reflects the graph of the original function y = f(x) across the y-axis. For every point (x, y) on the graph of f(x), the corresponding point on g(x) will be (-x, y).
Step 2: Identify key points on the graph of y = f(x). These key points might include the x-intercepts, y-intercepts, and any other notable points such as vertices or turning points.
Step 3: Apply the reflection transformation to each key point. For each point (x, y) on the graph of f(x), replace x with -x to find the corresponding point on g(x). For example, if a key point is (2, 3), the reflected point will be (-2, 3).
Step 4: Plot the reflected points on the graph. Ensure that you maintain the same y-coordinate for each point while flipping the x-coordinate to its opposite sign.
Step 5: Connect the reflected points smoothly to form the graph of g(x). Ensure that the overall shape of the graph matches the reflection of the original graph across the y-axis.

Risposta video verificata per un problema simile:
Questa soluzione video è stata consigliata dai nostri tutor come utile per risolvere questo problema.
Durata del video:
3mConcetti chiave
Ecco i concetti essenziali che devi comprendere per rispondere correttamente alla domanda.
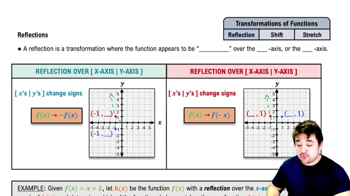
Function Reflection
The function g(x) = f(-x) represents a reflection of the function f(x) across the y-axis. This means that for every point (a, b) on the graph of f, there will be a corresponding point (-a, b) on the graph of g. Understanding this concept is crucial for accurately transforming the graph of f into g.
Video consigliato:
Reflections of Functions
Graphing Techniques
Graphing techniques involve methods for accurately plotting functions on a coordinate plane. This includes understanding how to manipulate the coordinates of points based on transformations such as reflections, translations, and stretches. Mastery of these techniques allows for effective visualization of how changes in the function's equation affect its graph.
Video consigliato:
Graphs and Coordinates - Example
Coordinate System
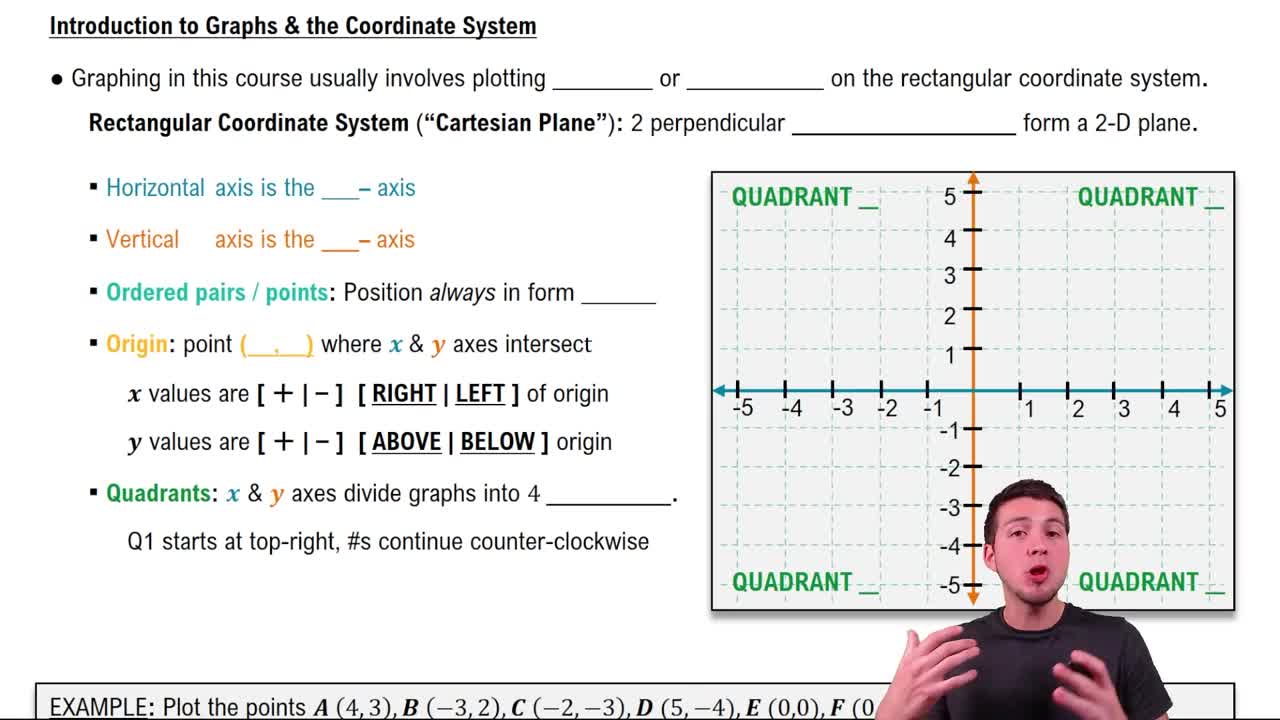
The coordinate system is a two-dimensional plane defined by an x-axis (horizontal) and a y-axis (vertical). Each point on this plane is represented by an ordered pair (x, y). Familiarity with the coordinate system is essential for interpreting and graphing functions, as it provides the framework for understanding the position and behavior of graphs.
Video consigliato:
Graphs & the Rectangular Coordinate System
Pratica correlata
Domanda del libro di testo
99
views
Domanda del libro di testo
In Exercises 11–26, determine whether each equation defines y as a function of x. |x| − y = 2
105
views
Domanda del libro di testo
The functions in Exercises 11-28 are all one-to-one. For each function, a. Find an equation for f-1(x), the inverse function. b. Verify that your equation is correct by showing that f(ƒ-1 (x)) = = x and ƒ-1 (f(x)) = x. f(x) = (x +4)/(x-2)
603
views
Domanda del libro di testo
Use the graph of y = f(x) to graph each function g.
g(x) = f(-x)+1
684
views
Domanda del libro di testo
Write an equation in slope-intercept form of a linear function f whose graph satisfies the given conditions. The graph of ƒ is perpendicular to the line whose equation is 3x - 2y - 4 = 0 and has the same y-intercept as this line.
115
views
Domanda del libro di testo
In Exercises 11–26, determine whether each equation defines y as a function of x. xy - 5y =1
113
views