Ch. 2 - Functions and Graphs
Blitzer - College Algebra 8th Edition
Blitzer8th EditionCollege AlgebraISBN: 9780136970514Non è quello che usi tu?Cambia libro di testo
Capitolo 3, Problema 33

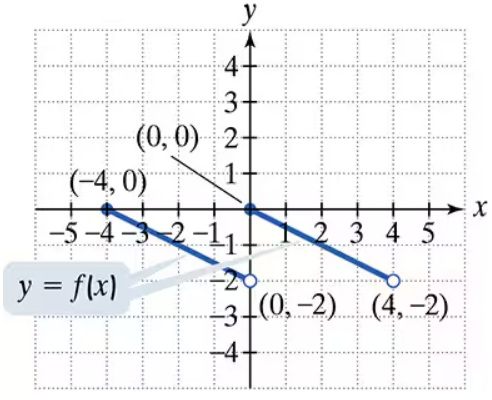
Use the graph of y = f(x) to graph each function g. g(x) = f(x)+2
Graph of y = f(x) showing two line segments with points at (-4,0), (0,0), (0,-2), and (4,-2) on a coordinate plane.

Guida verificata passo dopo passo
1
Understand that the function g(x) = f(x) + 2 represents a vertical shift of the original function f(x).
Recall that adding a constant to a function, like +2, shifts the entire graph of the function upward by that constant amount.
Take each point (x, y) on the graph of y = f(x) and transform it to a new point (x, y + 2) for the graph of g(x).
Plot these new points on the coordinate plane, maintaining the same x-values but increasing each y-value by 2.
Connect the new points smoothly, preserving the shape of the original graph, to complete the graph of g(x) = f(x) + 2.

Risposta video verificata per un problema simile:

Questa soluzione video è stata consigliata dai nostri tutor come utile per risolvere questo problema.
Durata del video:
2m

Concetti chiave

Ecco i concetti essenziali che devi comprendere per rispondere correttamente alla domanda.

Function Transformation

Function transformation involves changing the graph of a function in specific ways, such as shifting, stretching, or reflecting. In this case, adding a constant to the function, g(x) = f(x) + 2, shifts the graph vertically.
Video consigliato:
4:22
Domain & Range of Transformed Functions

Vertical Shift

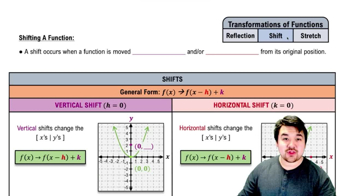
A vertical shift moves the entire graph of a function up or down without changing its shape. Adding 2 to f(x) raises every point on the graph by 2 units, so the graph of g(x) = f(x) + 2 is the graph of f(x) shifted up 2 units.
Video consigliato:
5:34
Shifts of Functions

Graphing Functions

Graphing functions involves plotting points that satisfy the function's equation and connecting them smoothly. Understanding how transformations affect the graph helps in sketching the new function accurately based on the original graph.
Video consigliato:
5:26
Graphs of Logarithmic Functions