Ch. 2 - Functions and Graphs
Blitzer - College Algebra 8th Edition
Blitzer8th EditionCollege AlgebraISBN: 9780136970514Non è quello che usi tu?Cambia libro di testo
Capitolo 3, Problema 39

Graph the given functions, f and g, in the same rectangular coordinate system. Select integers for x, starting with -2 and ending with 2. Once you have obtained your graphs, describe how the graph of g is related to the graph of f. f(x) = x, g(x) = x + 3

Guida verificata passo dopo passo
1
Identify the given functions: \(f(x) = x\) and \(g(x) = x + 3\).
Create a table of values for \(x\) starting from \(-2\) to \(2\). For each \(x\), calculate \(f(x)\) and \(g(x)\) separately.
For \(f(x) = x\), the values will be the same as \(x\) itself. For \(g(x) = x + 3\), add 3 to each \(x\) value to find the corresponding \(g(x)\) values.
Plot the points for both functions on the same coordinate system using the calculated values. For example, plot \((x, f(x))\) and \((x, g(x))\) for each \(x\) from \(-2\) to \(2\).
Observe the graphs: describe how the graph of \(g\) is related to the graph of \(f\). Consider how adding 3 to \(x\) affects the position of the graph compared to \(f(x)\).

Risposta video verificata per un problema simile:

Questa soluzione video è stata consigliata dai nostri tutor come utile per risolvere questo problema.
Durata del video:
8m

Concetti chiave

Ecco i concetti essenziali che devi comprendere per rispondere correttamente alla domanda.

Function Notation and Evaluation

Function notation, such as f(x) and g(x), represents a rule that assigns each input x to exactly one output. Evaluating a function means substituting a specific value for x to find the corresponding output, which is essential for plotting points on a graph.
Video consigliato:
4:26
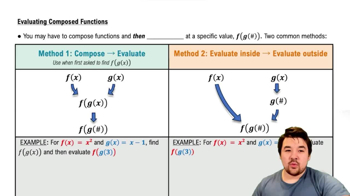
Evaluating Composed Functions

Graphing Linear Functions

Linear functions like f(x) = x produce straight-line graphs. Plotting points for selected x-values and connecting them helps visualize the function. Understanding the slope and intercept aids in sketching and comparing graphs.
Video consigliato:
5:26
Graphs of Logarithmic Functions

Vertical Translation of Graphs

Adding a constant to a function, as in g(x) = x + 3, shifts the graph vertically. Specifically, g(x) is the graph of f(x) moved up by 3 units. Recognizing this transformation helps describe the relationship between the two graphs.
Video consigliato:
3:12
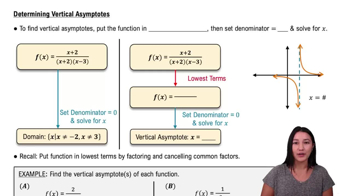
Determining Vertical Asymptotes