Ch. 2 - Functions and Graphs
Blitzer - College Algebra 8th Edition
Blitzer8th EditionCollege AlgebraISBN: 9780136970514Non è quello che usi tu?Cambia libro di testo
Capitolo 3, Problema 62

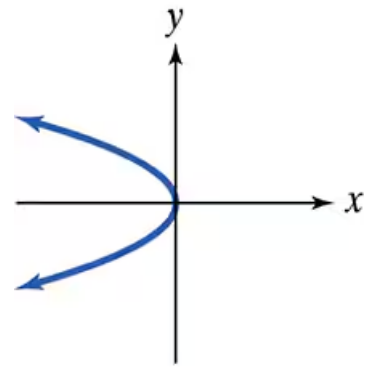
Use the vertical line test to identify graphs in which y is a function of x.

Guida verificata passo dopo passo
1
Recall that the vertical line test is used to determine if a graph represents a function of x. The test states that if any vertical line intersects the graph at more than one point, then y is not a function of x.
Observe the graph carefully and imagine drawing vertical lines (lines parallel to the y-axis) at various x-values along the curve.
Notice that for some x-values, a vertical line will intersect the graph at two points (one on the upper branch and one on the lower branch of the curve).
Since there are vertical lines that intersect the graph at more than one point, this means that for those x-values, there are multiple y-values.
Conclude that the graph does not pass the vertical line test, so y is not a function of x for this graph.

Risposta video verificata per un problema simile:

Questa soluzione video è stata consigliata dai nostri tutor come utile per risolvere questo problema.
Durata del video:
50s

Concetti chiave

Ecco i concetti essenziali che devi comprendere per rispondere correttamente alla domanda.

Vertical Line Test

The vertical line test is a visual method used to determine if a graph represents a function. If any vertical line drawn through the graph intersects it at more than one point, the graph does not represent a function because a single input (x-value) corresponds to multiple outputs (y-values).
Video consigliato:
06:49
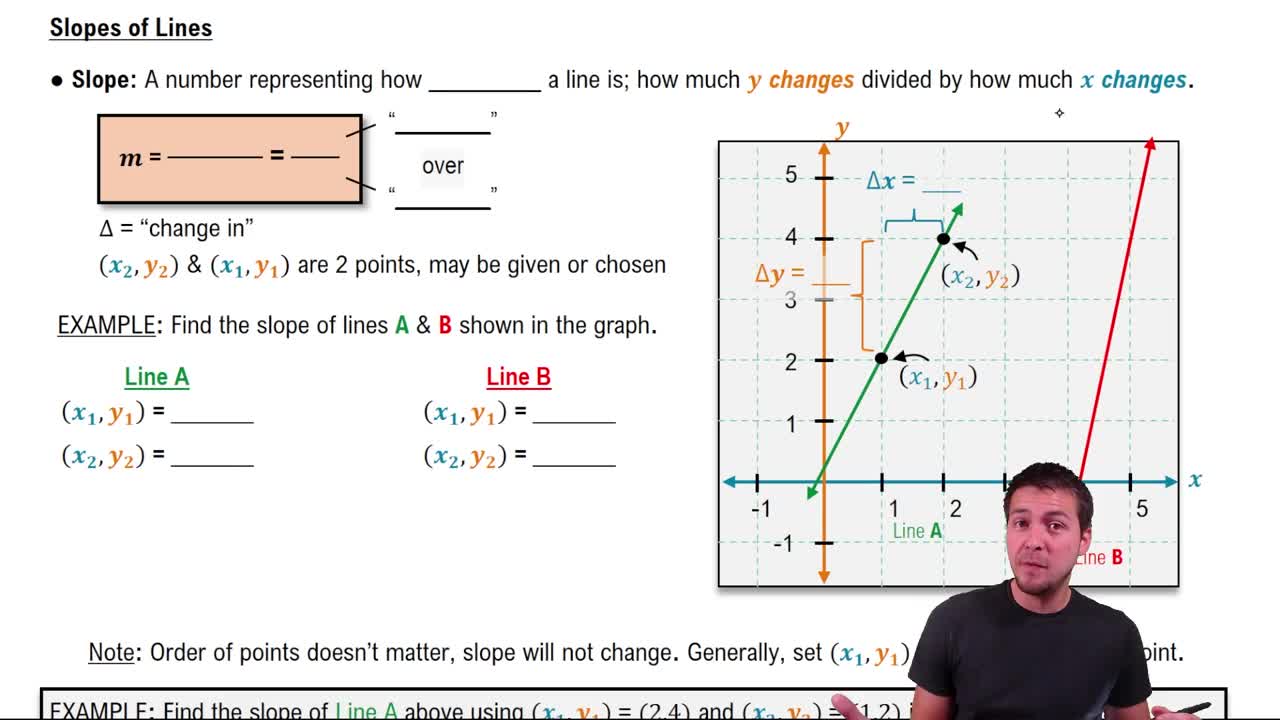
The Slope of a Line

Definition of a Function

A function is a relation where each input (x-value) has exactly one output (y-value). This means no x-value can be paired with more than one y-value. Understanding this definition is essential to apply the vertical line test correctly.
Video consigliato:
5:57
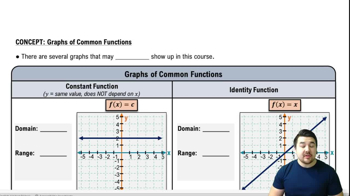
Graphs of Common Functions

Graph Interpretation

Interpreting graphs involves understanding the relationship between variables and how they are represented visually. Recognizing the shape and behavior of the graph, such as whether it curves back or overlaps vertically, helps in applying tests like the vertical line test to identify functions.
Video consigliato:
02:16
Graphs and Coordinates - Example