Ch. 2 - Functions and Graphs
Blitzer - College Algebra 8th Edition
Blitzer8th EditionCollege AlgebraISBN: 9780136970514Non è quello che usi tu?Cambia libro di testo
Capitolo 3, Problema 18

Use the graph to determine (a) the function's domain, (b) the function's range, (c) the x-intercepts, if any, (d) the y-intercept, if there is one, (e) intervals on which the function is increasing, decreasing or constant, (f) the missing function values, indicated by question marks, below each graph.
Graph of a quadratic function showing its shape, x and y intercepts, and increasing/decreasing intervals.

Guida verificata passo dopo passo
1
Step 1: To determine the domain of the function, observe the graph horizontally along the x-axis. The graph extends indefinitely to the left and right, meaning the domain is all real numbers, expressed as (-∞, ∞).
Step 2: To find the range of the function, observe the graph vertically along the y-axis. The lowest point of the graph is at y = -3, and the graph increases indefinitely upwards. Therefore, the range is [-3, ∞).
Step 3: To identify the x-intercepts, locate the points where the graph crosses the x-axis. From the graph, the x-intercepts are at x = -2 and x = 2.
Step 4: To find the y-intercept, locate the point where the graph crosses the y-axis. From the graph, the y-intercept is at y = -3.
Step 5: To determine intervals of increase and decrease, observe the slope of the graph. The function decreases on the interval (-∞, 0) and increases on the interval (0, ∞).

Risposta video verificata per un problema simile:

Questa soluzione video è stata consigliata dai nostri tutor come utile per risolvere questo problema.
Durata del video:
1m

Concetti chiave

Ecco i concetti essenziali che devi comprendere per rispondere correttamente alla domanda.

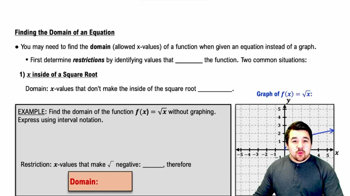
Domain

The domain of a function refers to the set of all possible input values (x-values) for which the function is defined. In the context of a graph, the domain can be determined by identifying the horizontal extent of the graph. For a quadratic function, the domain is typically all real numbers unless specified otherwise.
Video consigliato:
3:43
Finding the Domain of an Equation

Range

The range of a function is the set of all possible output values (y-values) that the function can produce. For a quadratic function, the range can be found by looking at the vertical extent of the graph. The vertex of the parabola indicates the minimum or maximum value, which helps define the range based on whether the parabola opens upwards or downwards.
Video consigliato:
4:22
Domain & Range of Transformed Functions

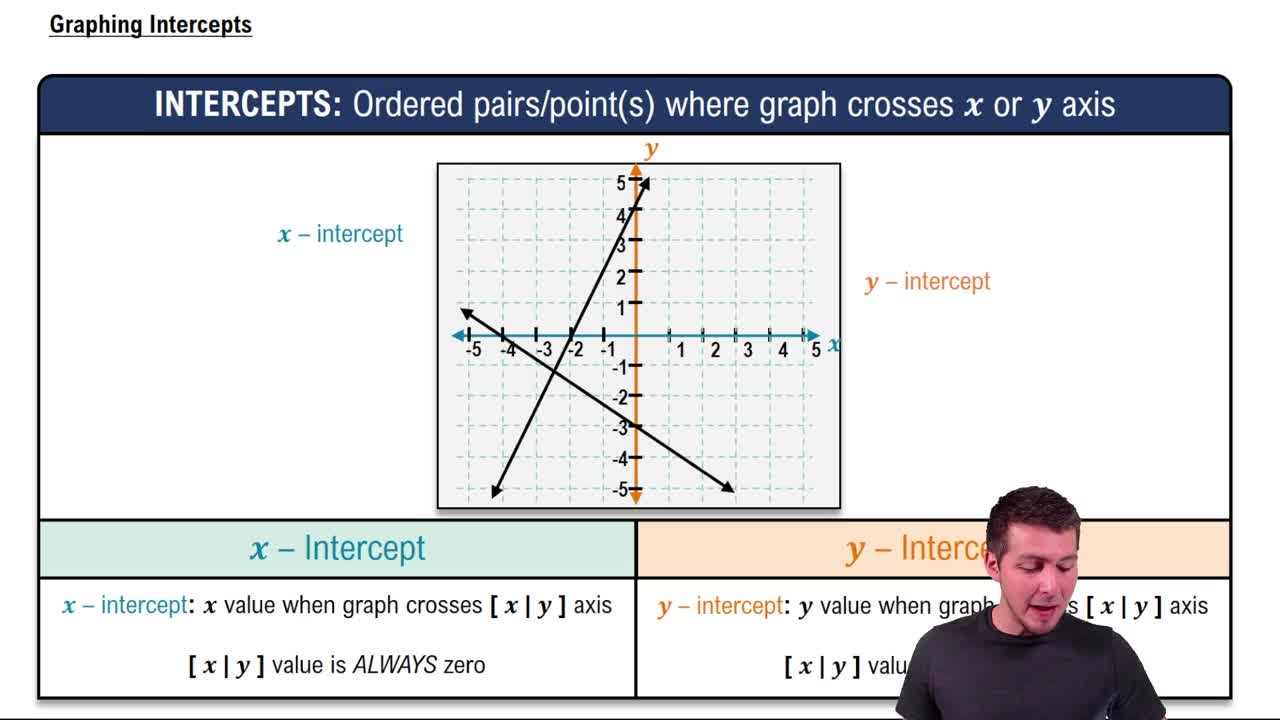
Intercepts

Intercepts are points where the graph of a function crosses the axes. The x-intercepts occur where the function's output is zero (y=0), while the y-intercept occurs where the input is zero (x=0). Identifying these points is crucial for understanding the behavior of the function and can be visually determined from the graph.
Video consigliato:
04:08
Graphing Intercepts