In Exercises 11–26, determine whether each equation defines y as a function of x. x + y = 16
Ch. 2 - Functions and Graphs

Capitolo 3, Problema 12
Use the vertical line test to identify graphs in which y is a function of x.

Guida verificata passo dopo passo1
The vertical line test is a method used to determine if a graph represents a function. A graph represents a function if and only if no vertical line intersects the graph at more than one point.
Observe the graph provided. It is a circle centered at the origin with a radius of approximately 3 units.
Imagine drawing vertical lines (parallel to the y-axis) across the graph. For example, consider a vertical line at x = 1. This line intersects the circle at two points: one above the x-axis and one below the x-axis.
Since there exists at least one vertical line that intersects the graph at more than one point, the graph does not pass the vertical line test.
Conclude that the graph does not represent y as a function of x because it fails the vertical line test.

Risposta video verificata per un problema simile:
Questa soluzione video è stata consigliata dai nostri tutor come utile per risolvere questo problema.
Durata del video:
1mConcetti chiave
Ecco i concetti essenziali che devi comprendere per rispondere correttamente alla domanda.
Vertical Line Test
The vertical line test is a method used to determine if a graph represents a function. If any vertical line intersects the graph at more than one point, the graph does not represent a function of x. This is because a function must assign exactly one output (y-value) for each input (x-value).
Video consigliato:
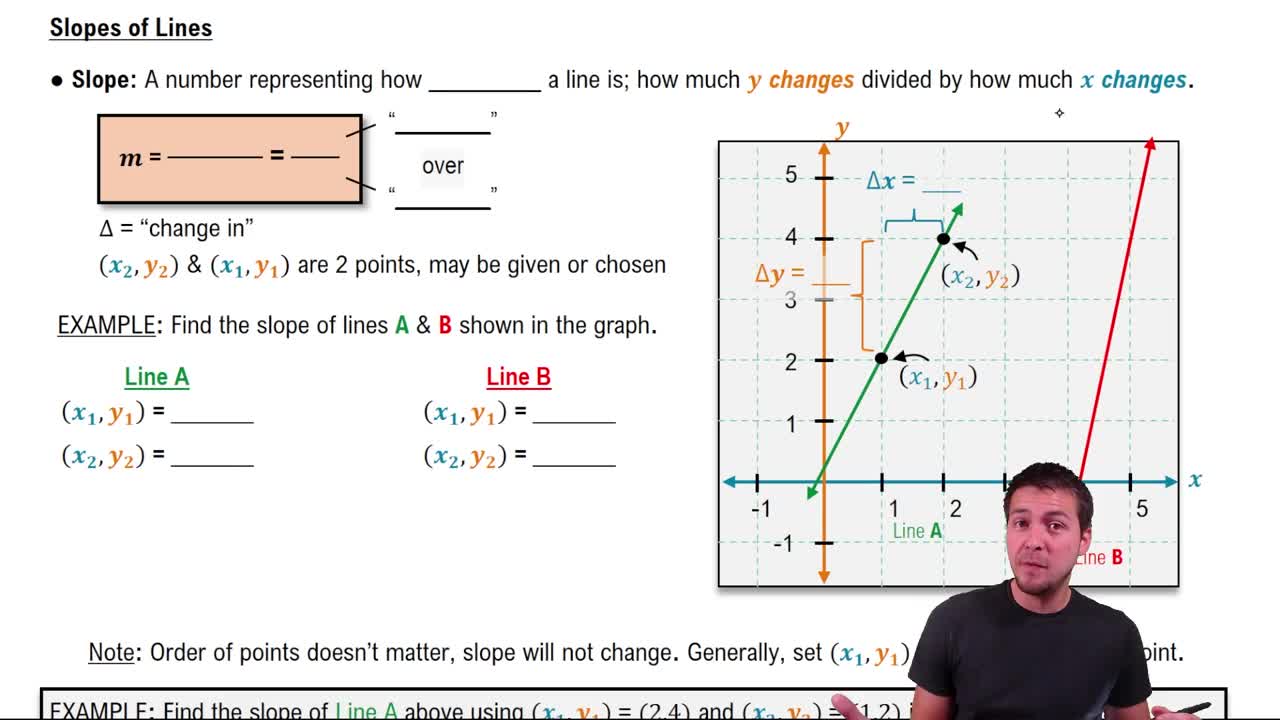
The Slope of a Line
Function Definition
A function is a relation between a set of inputs and a set of possible outputs where each input is related to exactly one output. In mathematical terms, for every x in the domain, there is a unique y in the range. Understanding this definition is crucial for identifying functions from their graphs.
Video consigliato:
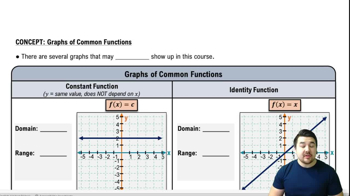
Graphs of Common Functions
Graph Interpretation
Interpreting graphs involves analyzing the visual representation of data or functions. In the context of the vertical line test, it requires recognizing how the shape of the graph (like a circle) affects the relationship between x and y. This skill is essential for determining whether a graph meets the criteria of a function.
Video consigliato:
Graphs and Coordinates - Example
Pratica correlata
Domanda del libro di testo
1922
views
Domanda del libro di testo
Use the graph of y = f(x) to graph each function g.
g(x) = 2f(x)
873
views
Domanda del libro di testo
Find the domain of each function. f(x) = 1/(x2+1) - 1/(x2-1)
969
views
Domanda del libro di testo
Use the given conditions to write an equation for each line in point-slope form and general form. Passing through (5, −9) and perpendicular to the line whose equation is x + 7y - 12= 0
170
views
Domanda del libro di testo
Use the given conditions to write an equation for each line in point-slope form and general form. Passing through (4, −7) and perpendicular to the line whose equation is x − 2y – 3 = 0
130
views
Domanda del libro di testo
The functions in Exercises 11-28 are all one-to-one. For each function, a. Find an equation for f-1(x), the inverse function. b. Verify that your equation is correct by showing that f(ƒ-1 (x)) = = x and ƒ-1 (f(x)) = x. f(x) = 2x
614
views