Use the vertex and intercepts to sketch the graph of each quadratic function. Give the equation of the parabola's axis of symmetry. Use the graph to determine the function's domain and range. f(x)=2(x+2)2−1
Ch. 3 - Polynomial and Rational Functions

Capitolo 4, Problema 23
Use the Leading Coefficient Test to determine the end behavior of the graph of the polynomial function.
Guida verificata passo dopo passo1
Identify the leading term of the polynomial function. For the given function \(f(x) = -5x^4 + 7x^2 - x + 9\), the leading term is \(-5x^4\) because it has the highest power of \(x\).
Determine the degree of the polynomial, which is the exponent of the leading term. Here, the degree is 4, an even number.
Look at the leading coefficient, which is the coefficient of the leading term. In this case, it is \(-5\), a negative number.
Apply the Leading Coefficient Test rules: For an even degree polynomial, if the leading coefficient is positive, both ends of the graph go up; if negative, both ends go down. Since the leading coefficient is negative, both ends of the graph will fall as \(x\) approaches \(\pm \infty\).
Summarize the end behavior: As \(x \to \infty\), \(f(x) \to -\infty\), and as \(x \to -\infty\), \(f(x) \to -\infty\).

Risposta video verificata per un problema simile:
Questa soluzione video è stata consigliata dai nostri tutor come utile per risolvere questo problema.
Durata del video:
1mConcetti chiave
Ecco i concetti essenziali che devi comprendere per rispondere correttamente alla domanda.
Polynomial Functions
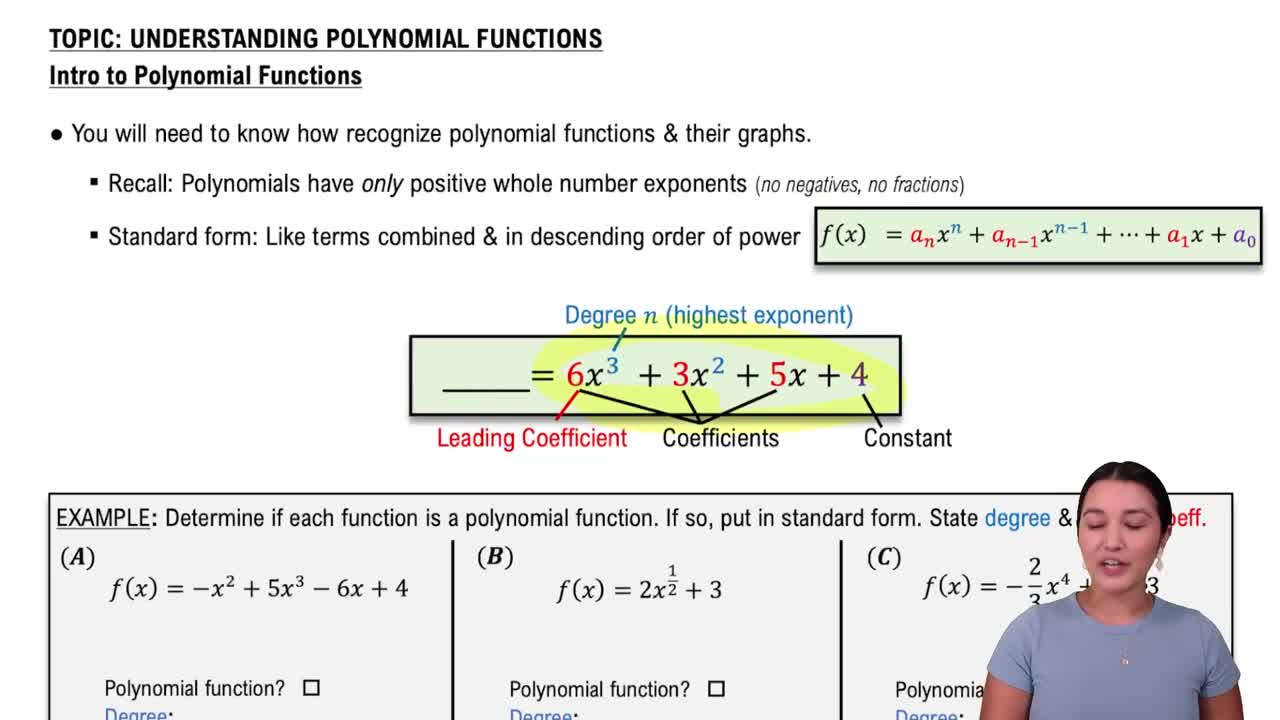
A polynomial function is an expression consisting of variables raised to non-negative integer powers, combined using addition, subtraction, and multiplication. Understanding the general form and degree of a polynomial helps in analyzing its graph and behavior.
Video consigliato:
Introduction to Polynomial Functions
Leading Coefficient Test
The Leading Coefficient Test uses the degree and leading coefficient of a polynomial to determine the end behavior of its graph. Specifically, the sign and parity (even or odd) of the leading term dictate whether the graph rises or falls as x approaches positive or negative infinity.
Video consigliato:
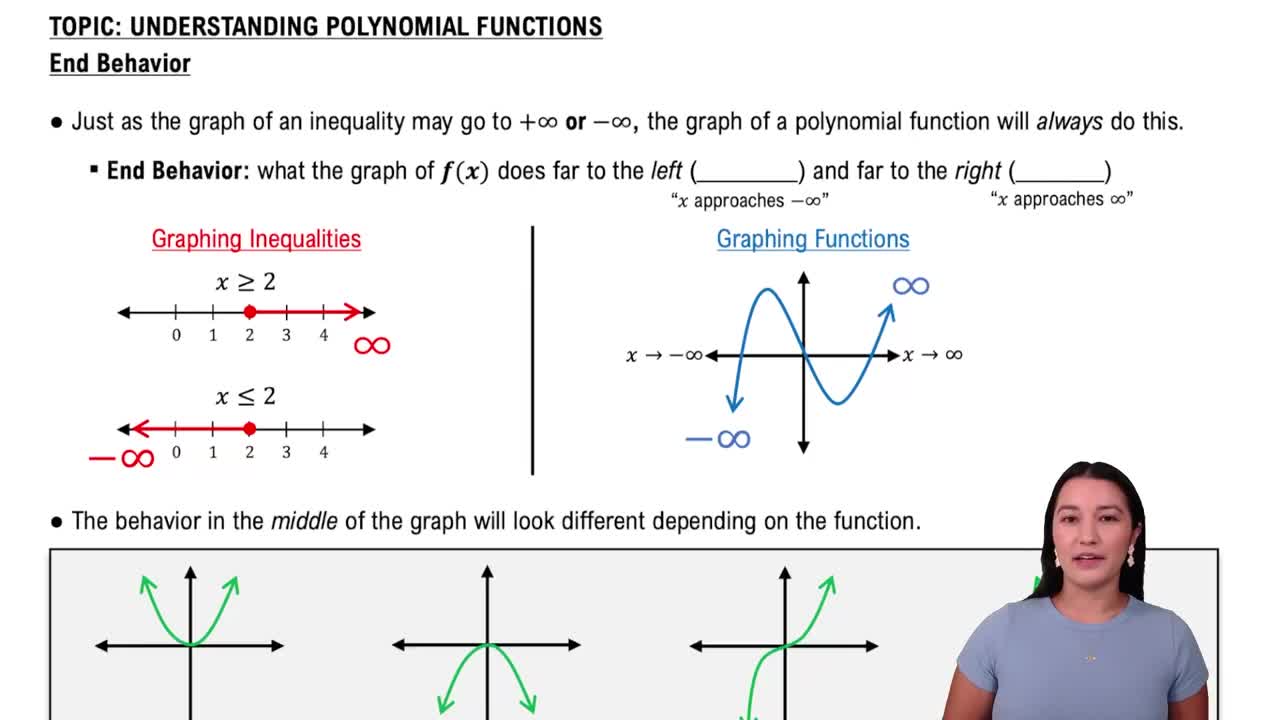
End Behavior of Polynomial Functions
End Behavior of Graphs
End behavior describes how the values of a function behave as the input x approaches very large positive or negative values. For polynomials, this is primarily influenced by the leading term, indicating whether the graph rises or falls on each end.
Video consigliato:
End Behavior of Polynomial Functions
Pratica correlata
Domanda del libro di testo
691
views
Domanda del libro di testo
Divide using synthetic division. (x5+4x4−3x2+2x+3)÷(x−3)
458
views
Domanda del libro di testo
Solve each polynomial inequality in Exercises 1–42 and graph the solution set on a real number line. Express each solution set in interval notation. −x2 + x ≥ 0
383
views
Domanda del libro di testo
Divide using synthetic division. (6x5−2x3+4x2−3x+1)÷(x−2)
479
views
Domanda del libro di testo
Find the vertical asymptotes, if any, and the values of x corresponding to holes, if any, of the graph of each rational function. g(x)=(x+3)/x(x+4)
661
views
Domanda del libro di testo
In Exercises 17–24, a) List all possible rational roots. b) List all possible rational roots. c) Use the quotient from part (b) to find the remaining roots and solve the equation. x4−2x3−5x2+8x+4=0
737
views