Ch. 3 - Polynomial and Rational Functions
Blitzer - College Algebra 8th Edition
Blitzer8th EditionCollege AlgebraISBN: 9780136970514Non è quello che usi tu?Cambia libro di testo
Capitolo 4, Problema 77

In Exercises 57–80, follow the seven steps to graph each rational function. f(x)=(x2+x−12)/(x2−4)

Guida verificata passo dopo passo
1
Identify the domain of the function by finding the values of x that make the denominator zero. Solve x^2 - 4 = 0 to find these values, since division by zero is undefined.
Factor both the numerator and denominator to simplify the function if possible. Factor x^2 + x - 12 and x^2 - 4 to their binomial factors.
Determine the vertical asymptotes by setting the denominator equal to zero and solving for x. These are the values excluded from the domain where the function may approach infinity or negative infinity.
Find the horizontal or oblique asymptote by comparing the degrees of the numerator and denominator polynomials. Use the degree rules to determine the end behavior of the function.
Calculate the x-intercepts by setting the numerator equal to zero and solving for x, and find the y-intercept by evaluating f(0) if it is in the domain.

Risposta video verificata per un problema simile:

Questa soluzione video è stata consigliata dai nostri tutor come utile per risolvere questo problema.
Durata del video:
5m

Concetti chiave

Ecco i concetti essenziali che devi comprendere per rispondere correttamente alla domanda.

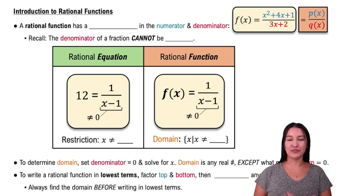
Rational Functions

A rational function is a ratio of two polynomials, expressed as f(x) = P(x)/Q(x). Understanding its domain, where the denominator Q(x) ≠ 0, is essential to avoid undefined values and to analyze the function's behavior.
Video consigliato:
6:04
Intro to Rational Functions

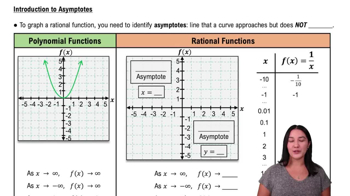
Finding Asymptotes

Asymptotes are lines that the graph approaches but never touches. Vertical asymptotes occur where the denominator is zero (and numerator is nonzero), while horizontal or oblique asymptotes describe end behavior based on the degrees of numerator and denominator polynomials.
Video consigliato:
6:24
Introduction to Asymptotes

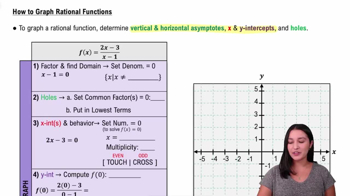
Graphing Steps for Rational Functions

Graphing involves seven steps: determining domain, intercepts, asymptotes, sign analysis, and plotting points. This systematic approach helps visualize the function's shape and behavior accurately.
Video consigliato:
8:19
How to Graph Rational Functions