Ch. 3 - Polynomial and Rational Functions
Blitzer - College Algebra 8th Edition
Blitzer8th EditionCollege AlgebraISBN: 9780136970514Non è quello che usi tu?Cambia libro di testo
Capitolo 4, Problema 72

In Exercises 71–72, use the graph of the polynomial function to solve each inequality.


2x3 + 11x2 < 7x + 6
Graph of the polynomial function f(x) = 2x^3 + 11x^2 - 7x - 6.

Guida verificata passo dopo passo
1
Rewrite the given inequality \(2x^{3} + 11x^{2} < 7x + 6\) by bringing all terms to one side to set the inequality to zero: \(2x^{3} + 11x^{2} - 7x - 6 < 0\).
Recognize that the left side of the inequality is the polynomial function \(f(x) = 2x^{3} + 11x^{2} - 7x - 6\) whose graph is provided.
Identify the x-intercepts (roots) of the polynomial from the graph, which are approximately at \(x = -7\), \(x = -3\), and \(x = 1\). These points divide the x-axis into intervals.
Determine the sign of \(f(x)\) on each interval by observing whether the graph is above or below the x-axis: where the graph is below the x-axis, \(f(x) < 0\); where it is above, \(f(x) > 0\).
Write the solution to the inequality \(f(x) < 0\) as the union of intervals where the graph lies below the x-axis, using the roots as boundaries.

Risposta video verificata per un problema simile:

Questa soluzione video è stata consigliata dai nostri tutor come utile per risolvere questo problema.
Durata del video:
3m

Concetti chiave

Ecco i concetti essenziali che devi comprendere per rispondere correttamente alla domanda.

Polynomial Inequalities

Polynomial inequalities involve expressions where a polynomial is compared to another value using inequality signs. Solving them requires determining where the polynomial function is greater than or less than a given value, often by analyzing the sign of the polynomial over intervals.
Video consigliato:
06:07
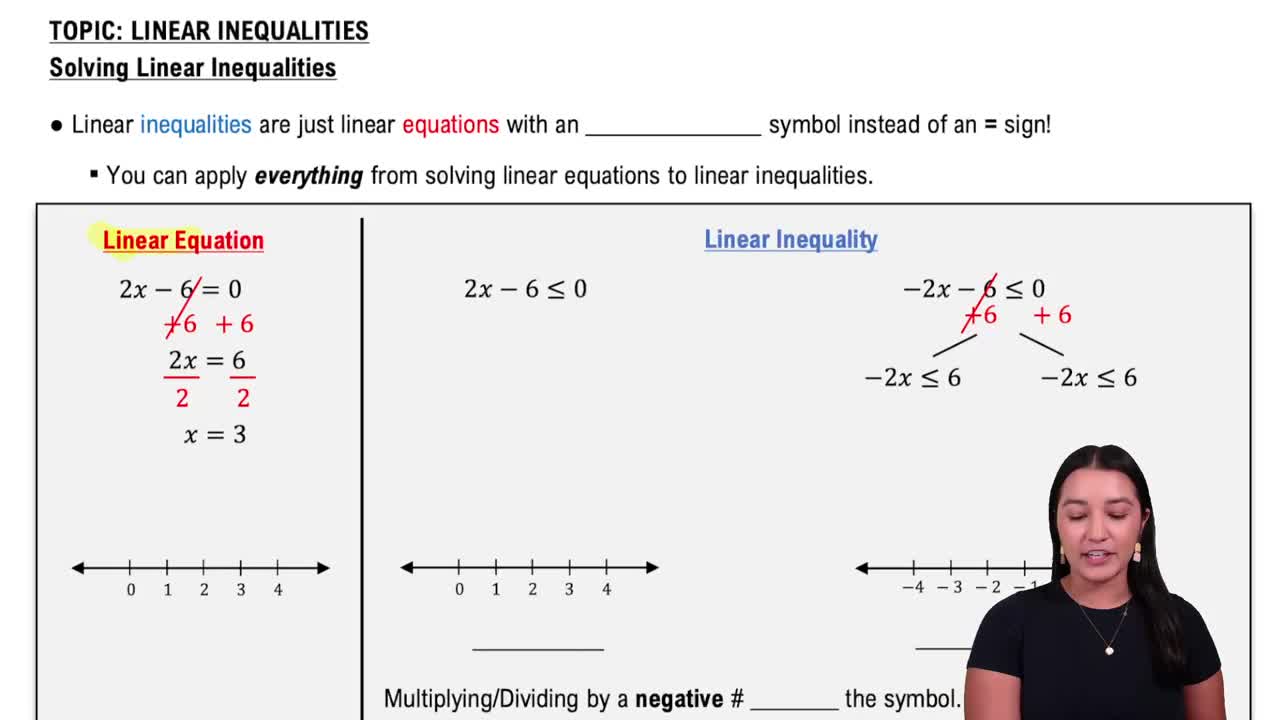
Linear Inequalities

Graph Interpretation of Polynomial Functions

The graph of a polynomial function shows its behavior, including where it crosses the x-axis (roots) and where it is positive or negative. By examining the graph, one can identify intervals where the function lies above or below a certain value, which helps solve inequalities.
Video consigliato:
05:25
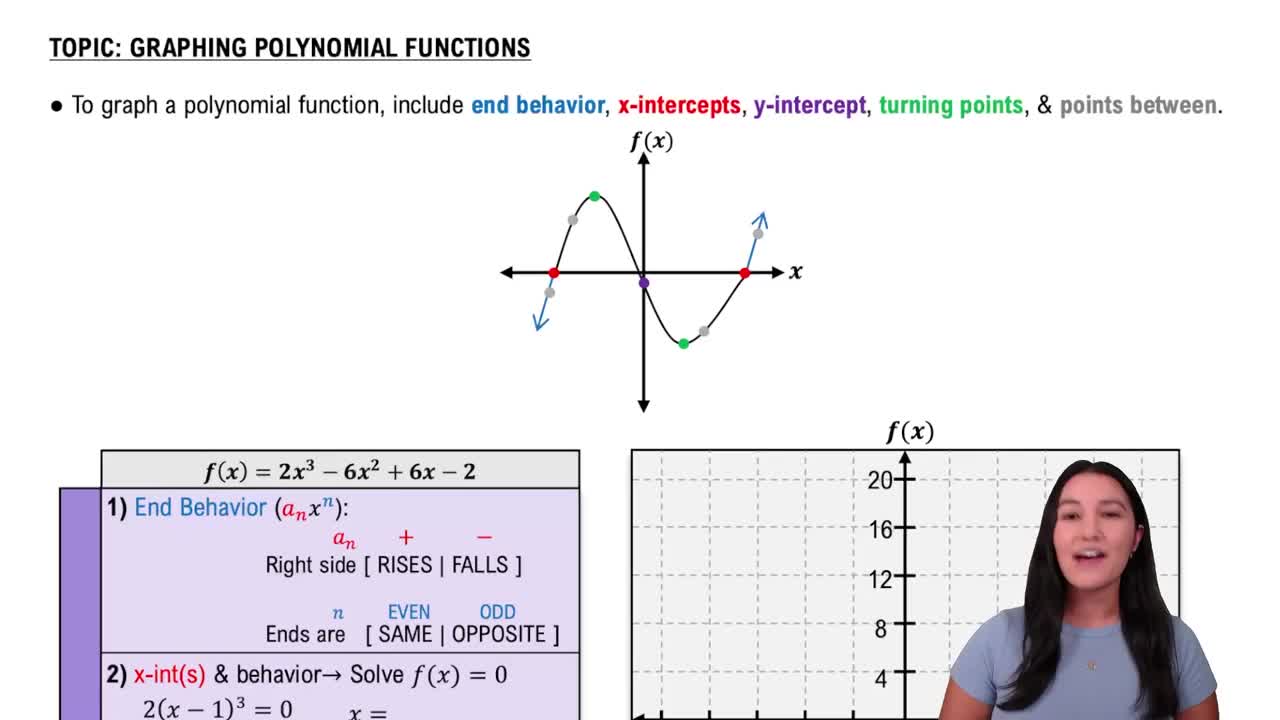
Graphing Polynomial Functions

Finding Roots and Critical Points

Roots are the x-values where the polynomial equals zero, marking boundary points for inequality solutions. Critical points, where the function changes direction, help determine the shape of the graph and the sign of the polynomial in different intervals.
Video consigliato:
02:20
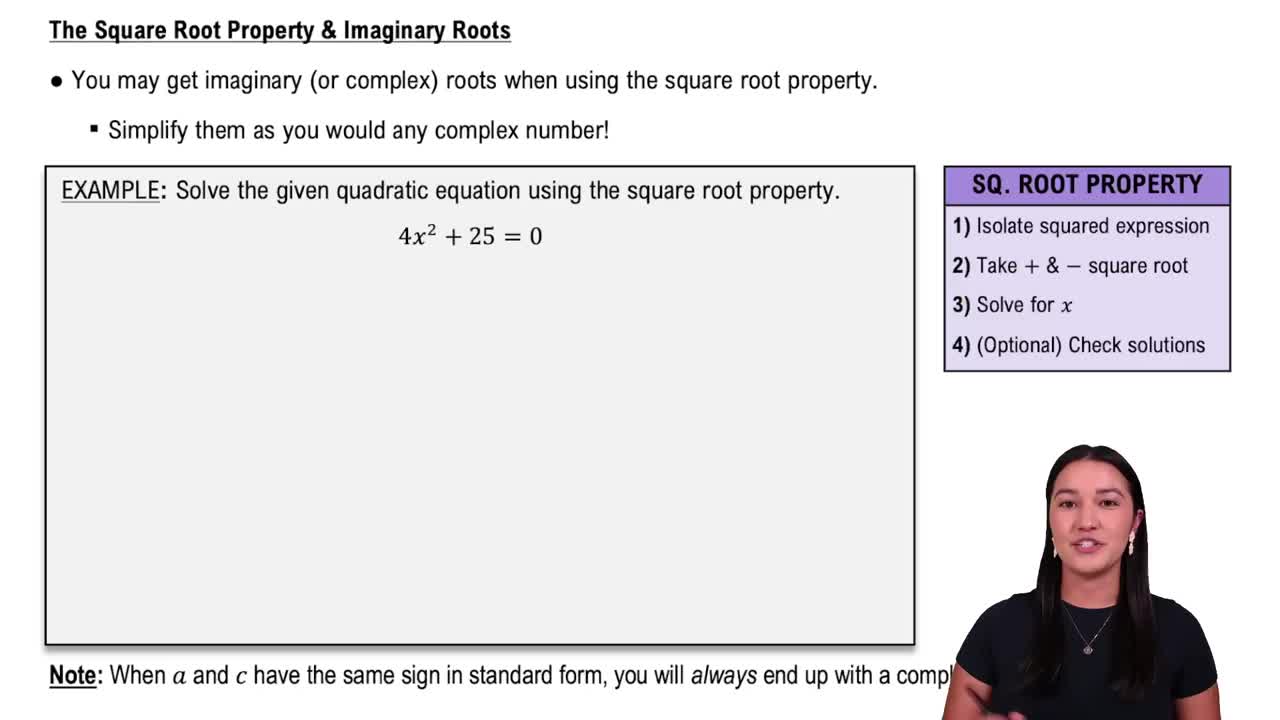
Imaginary Roots with the Square Root Property