Find the coordinates of the vertex for the parabola defined by the given quadratic function. f(x)=−2(x+1)2+5
Ch. 3 - Polynomial and Rational Functions

Capitolo 4, Problema 11
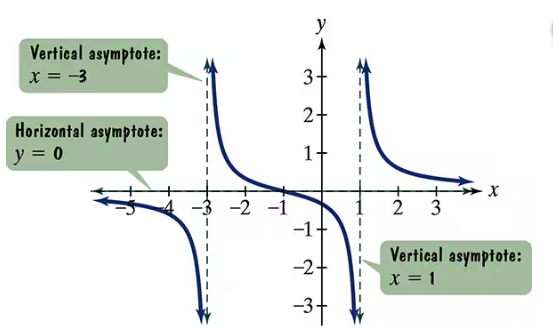
Use the graph of the rational function in the figure shown to complete each statement in Exercises 9–14.

As ______
Guida verificata passo dopo passo1
Identify the point of interest on the x-axis, which is \(x \to 1^-\), meaning we are approaching 1 from the left side.
Look at the graph near \(x = 1\) and observe the behavior of the function \(f(x)\) as \(x\) approaches 1 from values less than 1.
Notice that the graph is very close to the horizontal asymptote \(y = 0\) near \(x = 1\), and the function values are slightly below zero.
Since the function values are approaching zero from the negative side as \(x\) approaches 1 from the left, we conclude that \(f(x) \to 0^-\) as \(x \to 1^-\).
Therefore, the limit of \(f(x)\) as \(x\) approaches 1 from the left is 0, but the function values are slightly negative.

Risposta video verificata per un problema simile:
Questa soluzione video è stata consigliata dai nostri tutor come utile per risolvere questo problema.
Durata del video:
1mConcetti chiave
Ecco i concetti essenziali che devi comprendere per rispondere correttamente alla domanda.
Vertical Asymptotes
Vertical asymptotes occur where a function approaches infinity or negative infinity as the input approaches a specific value. They indicate values of x where the function is undefined, often due to division by zero in rational functions. In the graph, vertical asymptotes are shown at x = 6 and x = 14.
Video consigliato:
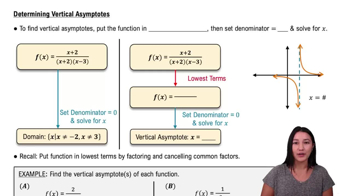
Determining Vertical Asymptotes
Horizontal Asymptotes
A horizontal asymptote represents the value that a function approaches as x approaches positive or negative infinity. It shows the end behavior of the function. In this graph, the horizontal asymptote is y = 0, meaning the function values get closer to zero as x becomes very large or very small.
Video consigliato:
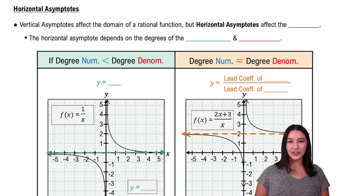
Determining Horizontal Asymptotes
Limit Behavior Near a Point
The limit of a function as x approaches a specific value from the left or right describes the function's behavior near that point. For example, as x approaches 1 from the left (x → 1⁻), the function value approaches a certain number or infinity. Understanding this helps in analyzing function continuity and asymptotic behavior.
Video consigliato:
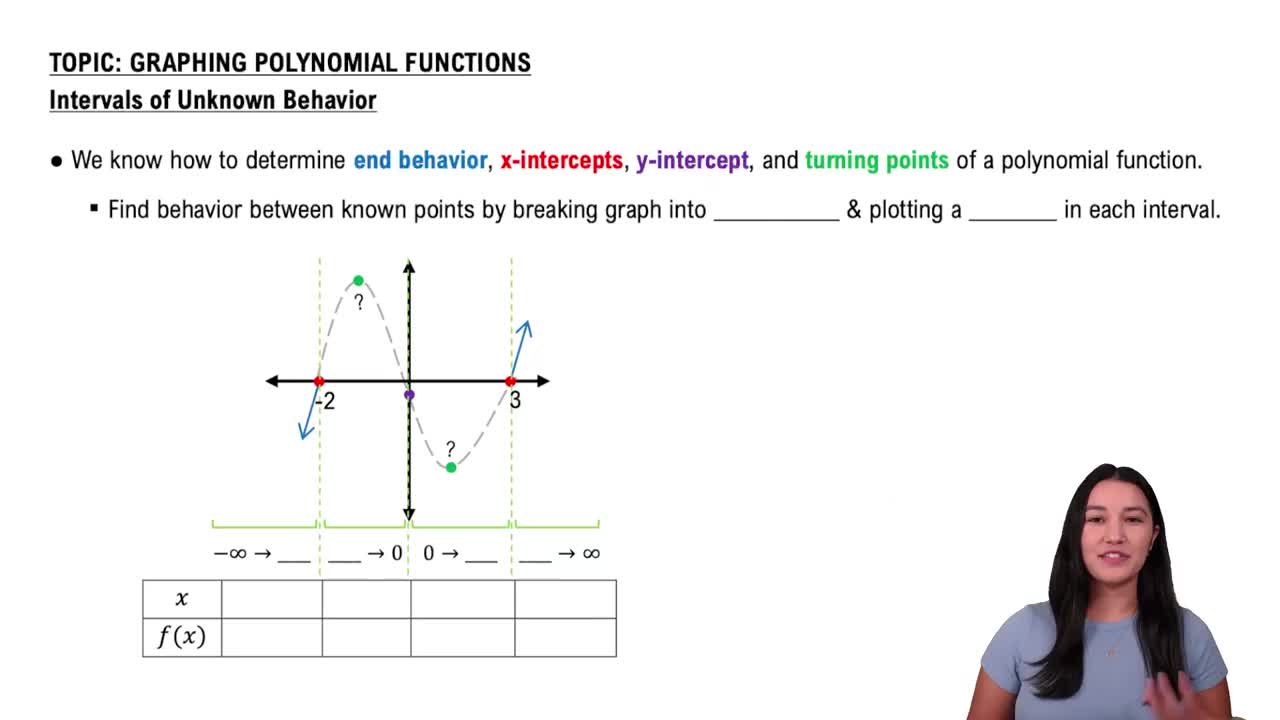
Identifying Intervals of Unknown Behavior
Pratica correlata
Domanda del libro di testo
1105
views
Domanda del libro di testo
Determine which functions are polynomial functions. For those that are, identify the degree.
1196
views
Domanda del libro di testo
Use the Leading Coefficient Test to determine the end behavior of the graph of the given polynomial function. Then use this end behavior to match the polynomial function with its graph. [The graphs are labeled (a) through (d).]
1576
views
Domanda del libro di testo
In Exercises 1–16, divide using long division. State the quotient, and the remainder, r(x). (3x2−2x+5)/(x−3)
635
views
1
rank
Domanda del libro di testo
Identify which graphs are not those of polynomial functions.
1037
views
Domanda del libro di testo
In Exercises 9–16, a) List all possible rational zeros. b) Use synthetic division to test the possible rational zeros and find an actual zero. c) Use the quotient from part (b) to find the remaining zeros of the polynomial function. f(x)=x3−2x2−11x+12
1081
views