
Ch. 4 - Exponential and Logarithmic Functions
Blitzer - College Algebra 8th Edition
Blitzer8th EditionCollege AlgebraISBN: 9780136970514Non è quello che usi tu?Cambia libro di testo
Capitolo 5, Problema 59

Graph y= 2x and x = 2y in the same rectangular coordinate system.

Guida verificata passo dopo passo
1
Identify the two functions to be graphed: the first is an exponential function \(y = 2^{x}\), and the second is \(x = 2^{y}\), which can be rewritten to express \(y\) in terms of \(x\) for easier graphing.
Rewrite the second equation \(x = 2^{y}\) by taking the logarithm base 2 of both sides to solve for \(y\): \(y = \log_{2}(x)\). This shows that the second graph is the logarithmic function, the inverse of the first.
Plot key points for \(y = 2^{x}\) by choosing several values of \(x\) (such as \(-2, -1, 0, 1, 2\)) and calculating the corresponding \(y\) values using \(y = 2^{x}\).
Plot key points for \(y = \log_{2}(x)\) by choosing several positive values of \(x\) (such as \(\frac{1}{4}, \frac{1}{2}, 1, 2, 4\)) and calculating the corresponding \(y\) values using \(y = \log_{2}(x)\).
Draw smooth curves through the plotted points for both functions on the same coordinate system, noting that the graphs are reflections of each other across the line \(y = x\) because they are inverse functions.

Risposta video verificata per un problema simile:

Questa soluzione video è stata consigliata dai nostri tutor come utile per risolvere questo problema.
Durata del video:
5m

Concetti chiave

Ecco i concetti essenziali che devi comprendere per rispondere correttamente alla domanda.

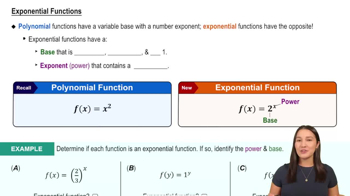
Exponential Functions

An exponential function has the form y = a^x, where the base a is a positive constant not equal to 1. It models rapid growth or decay, and its graph passes through (0,1) with a smooth curve increasing or decreasing depending on the base. Understanding y = 2^x helps in plotting one of the given functions.
Video consigliato:
6:13
Exponential Functions

Inverse Functions and Their Graphs

The function x = 2^y can be seen as the inverse of y = 2^x by swapping variables. Inverse functions reflect across the line y = x, so graphing both on the same axes shows this symmetry. Recognizing this relationship aids in understanding the shape and position of both graphs.
Video consigliato:
5:26
Graphs of Logarithmic Functions

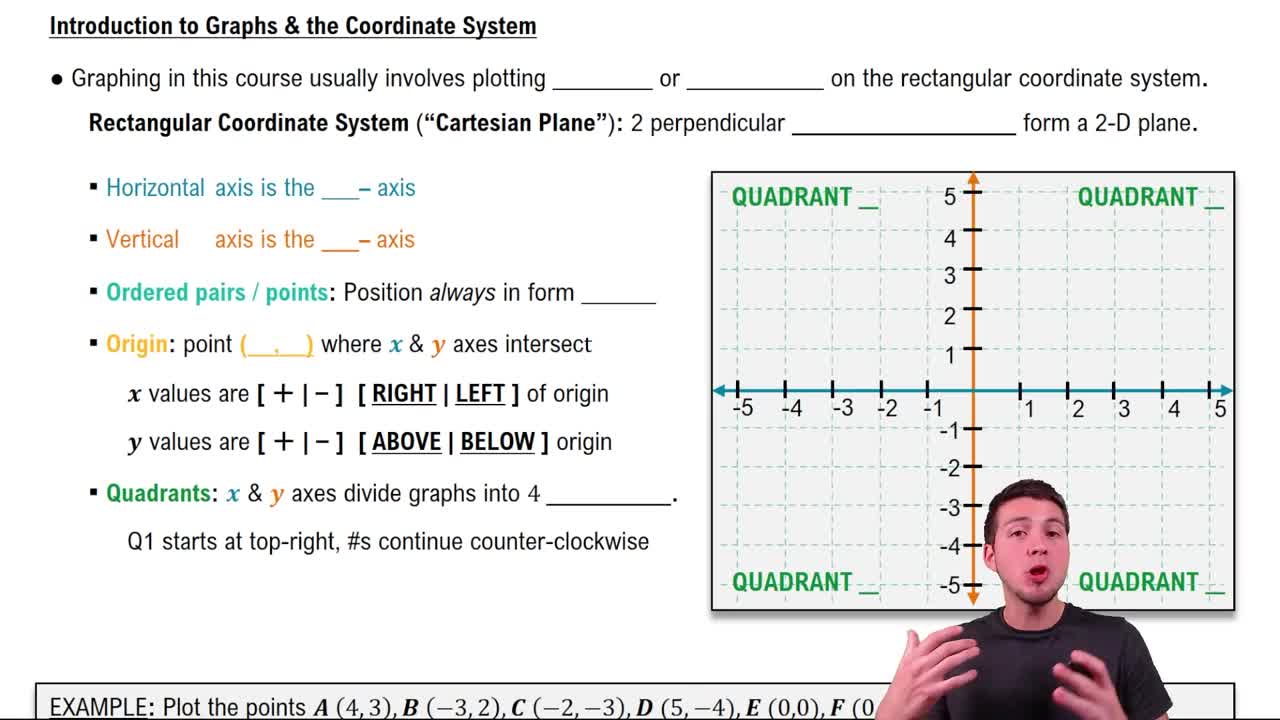
Coordinate System and Plotting Points

Plotting functions requires understanding the rectangular coordinate system, where each point is defined by (x, y). To graph y = 2^x and x = 2^y, select values for x or y, compute corresponding points, and plot them accurately. This visual representation helps compare and analyze the functions.
Video consigliato:
05:10
Graphs & the Rectangular Coordinate System
Pratica correlata
Domanda del libro di testo

In Exercises 60–63, determine whether each equation is true or false. Where possible, show work to support your conclusion. If the statement is false, make the necessary change(s) to produce a true statement. (ln x)(ln 1) = 0

747
views
Domanda del libro di testo

The figure shows the graph of f(x) = log x. In Exercises 59–64, use transformations of this graph to graph each function. Graph and give equations of the asymptotes. Use the graphs to determine each function's domain and range. h(x) = log x − 1

577
views
Domanda del libro di testo

Solve each logarithmic equation in Exercises 49–92. Be sure to reject any value of x that is not in the domain of the original logarithmic expressions. Give the exact answer. Then, where necessary, use a calculator to obtain a decimal approximation, correct to two decimal places, for the solution. log4(3x+2)=3

730
views
Domanda del libro di testo

In Exercises 58–59, use common logarithms or natural logarithms and a calculator to evaluate to four decimal places. log4 0.863

991
views
Domanda del libro di testo

Solve each logarithmic equation in Exercises 49–92. Be sure to reject any value of x that is not in the domain of the original logarithmic expressions. Give the exact answer. Then, where necessary, use a calculator to obtain a decimal approximation, correct to two decimal places, for the solution. 5 ln(2x)=20

809
views
Domanda del libro di testo

The figure shows the graph of f(x) = log x. In Exercises 59–64, use transformations of this graph to graph each function. Graph and give equations of the asymptotes. Use the graphs to determine each function's domain and range. g(x) = log(x − 1)

580
views