
Ch. 4 - Exponential and Logarithmic Functions
Blitzer - College Algebra 8th Edition
Blitzer8th EditionCollege AlgebraISBN: 9780136970514Non è quello che usi tu?Cambia libro di testo
Capitolo 5, Problema 57

Graph f and g in the same rectangular coordinate system. Then find the point of intersection of the two graphs. f(x) = 2x, g(x) = 2-x

Guida verificata passo dopo passo
1
First, understand the functions given: \(f(x) = 2^x\) is an exponential growth function, and \(g(x) = 2^{-x}\) is an exponential decay function. Both are defined for all real numbers \(x\).
To graph both functions on the same coordinate system, create a table of values for each function by choosing several \(x\) values (for example, \(-2, -1, 0, 1, 2\)) and calculating the corresponding \(f(x)\) and \(g(x)\) values.
Plot the points from the tables for \(f(x)\) and \(g(x)\) on the coordinate plane. Remember that \(f(x) = 2^x\) increases as \(x\) increases, while \(g(x) = 2^{-x}\) decreases as \(x\) increases.
To find the point of intersection algebraically, set the two functions equal to each other: \(2^x = 2^{-x}\). This equation will help find the \(x\)-value(s) where the graphs intersect.
Solve the equation \(2^x = 2^{-x}\) by using properties of exponents. For example, rewrite \(2^{-x}\) as \(\frac{1}{2^x}\) and solve for \(x\). Once you find \(x\), substitute it back into either \(f(x)\) or \(g(x)\) to find the corresponding \(y\)-coordinate of the intersection point.

Risposta video verificata per un problema simile:

Questa soluzione video è stata consigliata dai nostri tutor come utile per risolvere questo problema.
Durata del video:
5m

Concetti chiave

Ecco i concetti essenziali che devi comprendere per rispondere correttamente alla domanda.

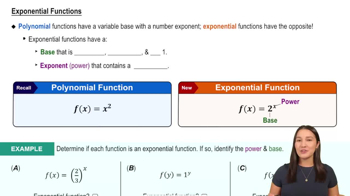
Exponential Functions

Exponential functions have the form f(x) = a^x, where the base a is a positive constant. They model rapid growth or decay depending on whether the exponent is positive or negative. Understanding their shape and behavior is essential for graphing and analyzing functions like f(x) = 2^x and g(x) = 2^-x.
Video consigliato:
6:13
Exponential Functions

Graphing Functions on the Coordinate Plane

Graphing involves plotting points (x, f(x)) on the rectangular coordinate system to visualize the function's behavior. Comparing two graphs on the same axes helps identify intersections and relative positions. Accurate plotting of exponential functions reveals their growth and decay patterns.
Video consigliato:
02:16
Graphs and Coordinates - Example

Finding Points of Intersection

The point of intersection of two graphs is where their function values are equal, i.e., f(x) = g(x). Solving this equation algebraically or by inspection gives the x-coordinate(s) of intersection. Substituting back finds the corresponding y-coordinate(s), providing the exact intersection point(s).
Video consigliato:
04:27
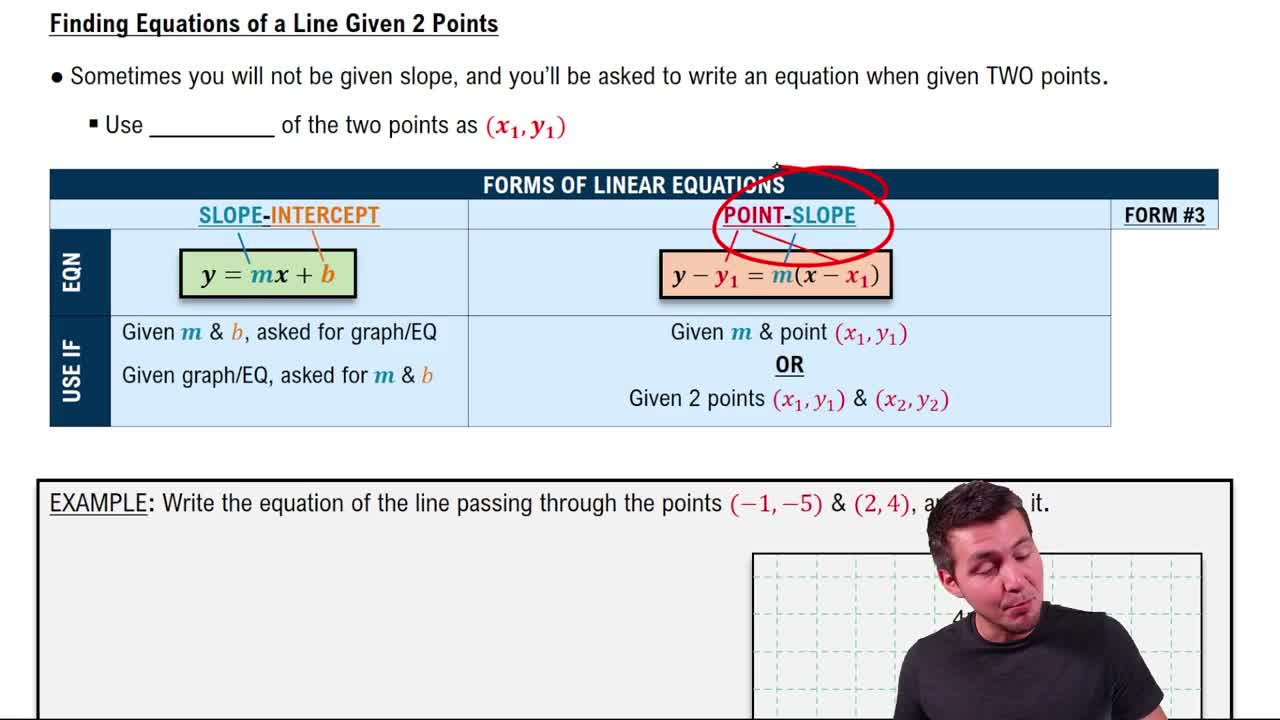
Finding Equations of Lines Given Two Points
Pratica correlata
Domanda del libro di testo

Solve each logarithmic equation in Exercises 49–92. Be sure to reject any value of x that is not in the domain of the original logarithmic expressions. Give the exact answer. Then, where necessary, use a calculator to obtain a decimal approximation, correct to two decimal places, for the solution. log3(x+4)=−3

755
views
Domanda del libro di testo

In Exercises 53-58, begin by graphing f(x) = log₂ x. Then use transformations of this graph to graph the given function. What is the vertical asymptote? Use the graphs to determine each function's domain and range. g(x) = (1/2)log₂ x

647
views
Domanda del libro di testo

Use properties of logarithms to condense each logarithmic expression. Write the expression as a single logarithm whose coefficient is 1. Where possible, evaluate logarithmic expressions without using a calculator. 5 ln x - 2 ln y

1059
views
Domanda del libro di testo

Use properties of logarithms to condense each logarithmic expression. Write the expression as a single logarithm whose coefficient is 1. (1/2)ln x - ln y

1433
views
Domanda del libro di testo

Begin by graphing f(x) = log₂ x. Then use transformations of this graph to graph the given function. What is the vertical asymptote? Use the graphs to determine each function's domain and range. h(x) = 2 + log2x

1057
views
Domanda del libro di testo

Begin by graphing f(x) = log₂ x. Then use transformations of this graph to graph the given function. What is the vertical asymptote? Use the graphs to determine each function's domain and range. h(x)=1+ log₂ x

732
views