Ch. 5 - Systems of Equations and Inequalities
Blitzer - College Algebra 8th Edition
Blitzer8th EditionCollege AlgebraISBN: 9780136970514Non è quello che usi tu?Cambia libro di testo
Capitolo 6, Problema 7

Graph each inequality. y>2x−1

Guida verificata passo dopo passo
1
Identify the inequality given: \(y > 2x - 1\). This represents all points \((x, y)\) where the \(y\)-value is greater than \(2x - 1\).
First, graph the boundary line \(y = 2x - 1\). This is a straight line with slope \(2\) and \(y\)-intercept \(-1\).
Since the inequality is strict ($>$, not \(\geq\)), draw the boundary line as a dashed line to indicate points on the line are not included in the solution.
Choose a test point not on the line, commonly \((0,0)\), and substitute into the inequality: check if \(0 > 2(0) - 1\) which simplifies to \(0 > -1\). Since this is true, shade the region of the graph that contains \((0,0)\).
The shaded region represents all solutions to the inequality \(y > 2x - 1\). This completes the graph of the inequality.

Risposta video verificata per un problema simile:

Questa soluzione video è stata consigliata dai nostri tutor come utile per risolvere questo problema.
Durata del video:
5m

Concetti chiave

Ecco i concetti essenziali che devi comprendere per rispondere correttamente alla domanda.

Graphing Linear Inequalities

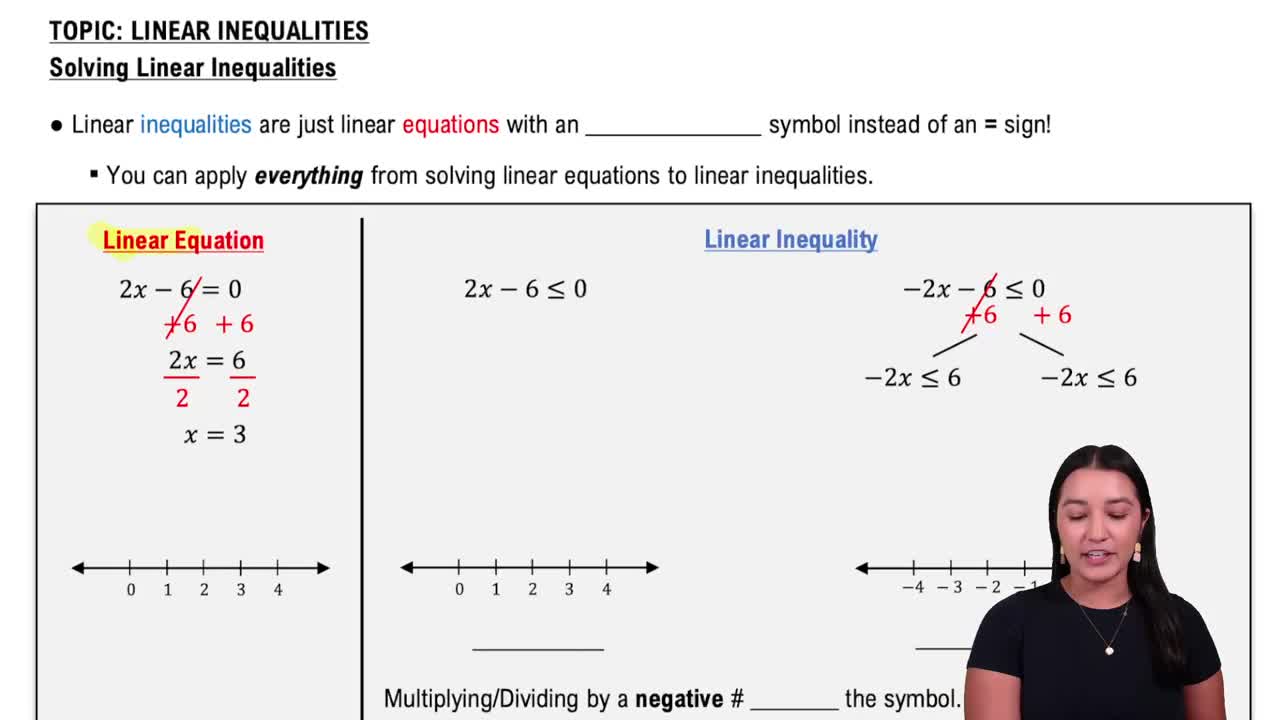
Graphing linear inequalities involves first graphing the related linear equation as a boundary line. The inequality symbol determines whether the boundary is solid (for ≤ or ≥) or dashed (for < or >). The solution region is the set of points that satisfy the inequality, typically shaded on one side of the boundary line.
Video consigliato:
06:07
Linear Inequalities

Slope-Intercept Form of a Line

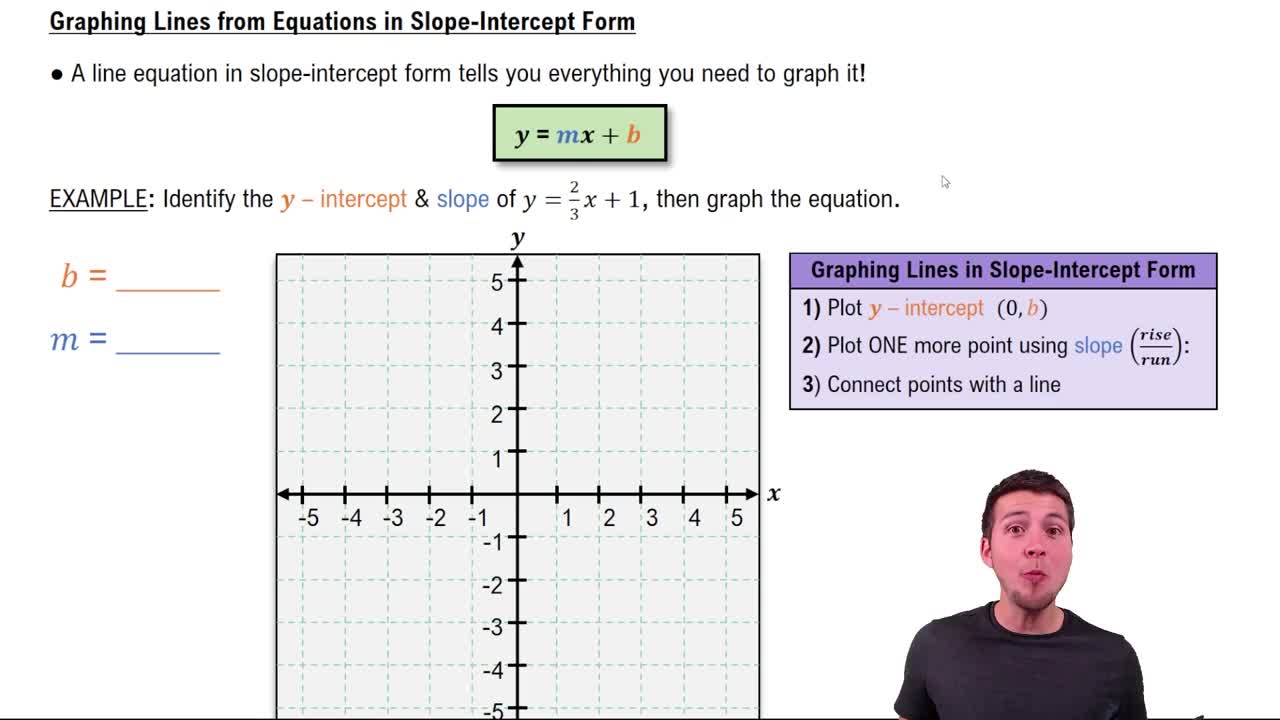
The slope-intercept form, y = mx + b, expresses a line where m is the slope and b is the y-intercept. It helps quickly graph the line by starting at (0, b) and using the slope to find other points. For y > 2x - 1, the slope is 2 and the y-intercept is -1.
Video consigliato:
02:35
Graphing Lines in Slope-Intercept Form

Testing Points to Determine the Solution Region

After graphing the boundary line, select a test point not on the line (often (0,0)) to check if it satisfies the inequality. If the test point makes the inequality true, shade the region containing that point; otherwise, shade the opposite side. This confirms the correct solution area.
Video consigliato:
13:10
Cramer's Rule - 3 Equations w/ 3 Unknowns