Ch. 5 - Systems of Equations and Inequalities
Blitzer - College Algebra 8th Edition
Blitzer8th EditionCollege AlgebraISBN: 9780136970514Non è quello che usi tu?Cambia libro di testo
Capitolo 6, Problema 27

Graph the solution set of each system of inequalities or indicate that the system has no solution.
{3x+6y≤62x+y≤8\(\begin{cases}\) 3x + 6y \(\leq\) 6 \\ 2x + y \(\leq\) 8 \(\end{cases}\)

Guida verificata passo dopo passo
1
Step 1: Identify the system of inequalities to graph: \[\left\{ \begin{array}{l} 2x + 4y \leq 8 \\ 4x + y \leq 4 \end{array} \right.\]
Step 2: Convert each inequality into an equation to find the boundary lines: For the first inequality: \[2x + 4y = 8\] For the second inequality: \[4x + y = 4\]
Step 3: Find the intercepts for each boundary line to help graph them: - For \[2x + 4y = 8\]: - When \[x=0\], solve for \[y\]: \[4y = 8 \Rightarrow y = 2\] - When \[y=0\], solve for \[x\]: \[2x = 8 \Rightarrow x = 4\] - For \[4x + y = 4\]: - When \[x=0\], solve for \[y\]: \[y = 4\] - When \[y=0\], solve for \[x\]: \[4x = 4 \Rightarrow x = 1\]
Step 4: Graph the boundary lines using the intercepts found. Since the inequalities are \( \leq \), shade the region below or on each line. To determine which side to shade, pick a test point (usually the origin \(0,0\)) and check if it satisfies the inequality.
Step 5: The solution set to the system is the intersection of the shaded regions from both inequalities. This overlapping region represents all points \((x,y)\) that satisfy both inequalities simultaneously.

Risposta video verificata per un problema simile:

Questa soluzione video è stata consigliata dai nostri tutor come utile per risolvere questo problema.
Durata del video:
1m

Concetti chiave

Ecco i concetti essenziali che devi comprendere per rispondere correttamente alla domanda.

Graphing Linear Inequalities

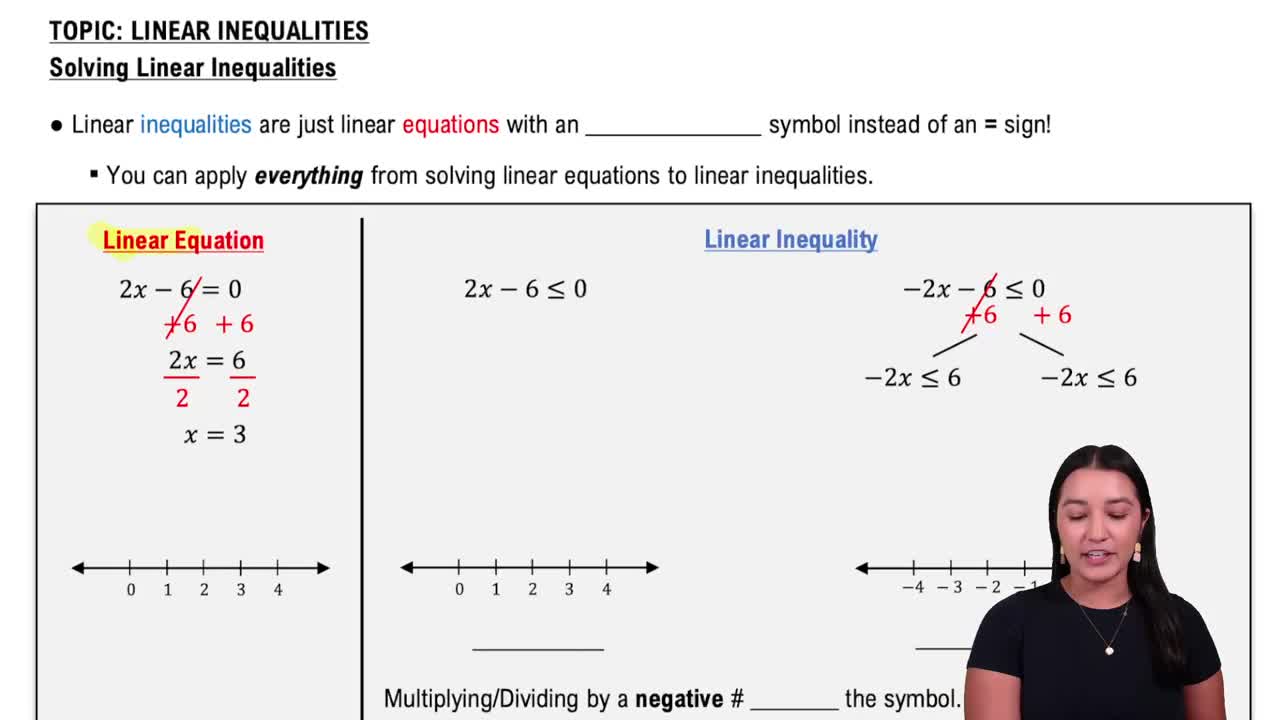
Graphing linear inequalities involves plotting the boundary line of the corresponding equation and shading the region that satisfies the inequality. The boundary line is solid if the inequality includes equality (≤ or ≥) and dashed if it does not (< or >). This visual representation helps identify all possible solutions to the inequality.
Video consigliato:
06:07
Linear Inequalities

System of Inequalities

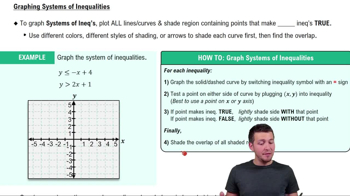
A system of inequalities consists of two or more inequalities considered simultaneously. The solution set is the intersection of the regions that satisfy each inequality individually. Graphing both inequalities on the same coordinate plane reveals the common shaded area representing all solutions.
Video consigliato:
6:19
Systems of Inequalities

Finding Boundary Lines and Test Points

To graph inequalities, first convert each inequality to an equation to find the boundary line. Then, select a test point not on the line (commonly the origin) to determine which side of the line satisfies the inequality. This method ensures accurate shading of the solution region.
Video consigliato:
04:27
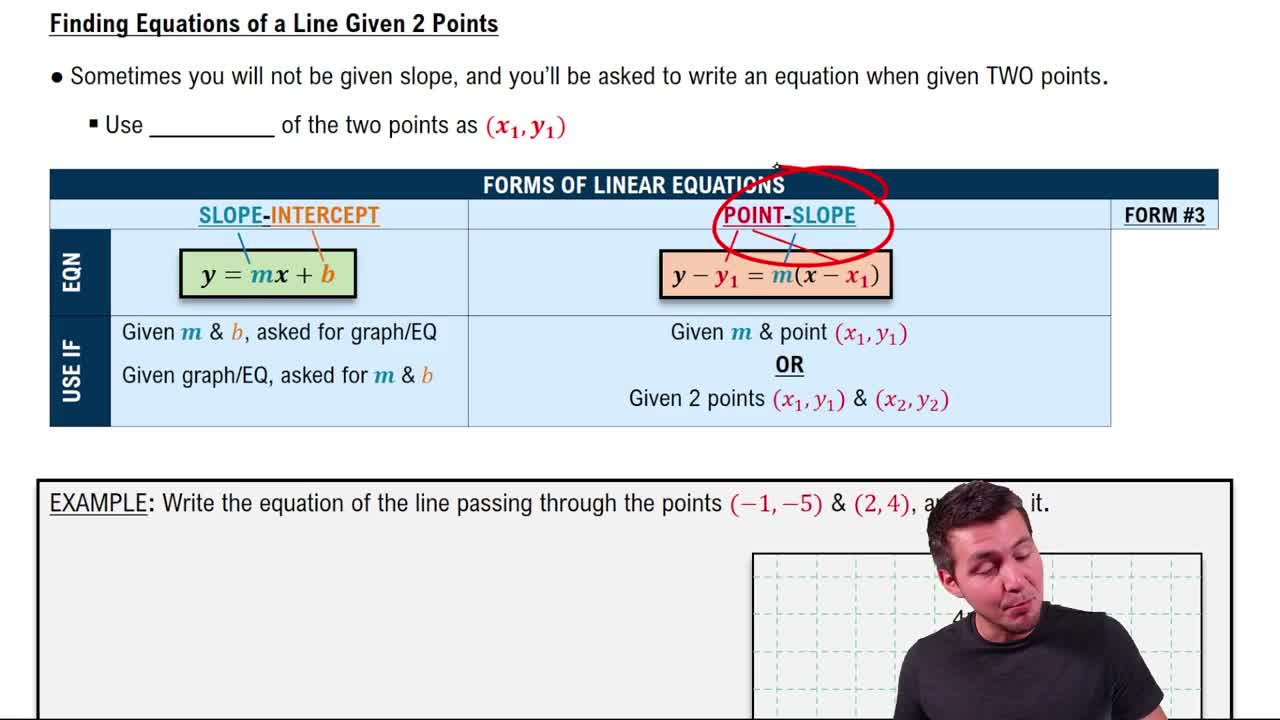
Finding Equations of Lines Given Two Points