 Indietro
Financial Statements and Cash Flow Analysis: Vodafone Group Plc Case Study
Guida di studio - Note intelligenti
 Appunti personalizzati basati sui tuoi materiali, ampliati con definizioni chiave, esempi e contesto.
Financial Statements and Cash Flow Analysis
Overview of Financial Statements
Financial statements are essential tools for managers, investors, and analysts to assess a company's financial health and performance. The four key financial statements are the Balance Sheet, Income Statement, Statement of Retained Earnings, and Statement of Cash Flows. Each provides unique insights into different aspects of a firm's operations and financial position.
Balance Sheet: Presents a snapshot of the firm's financial position at a specific point in time, showing assets, liabilities, and shareholders' equity.
Income Statement: Summarizes revenues, expenses, and profits over a period, indicating operational performance.
Statement of Retained Earnings: Shows changes in retained earnings due to net income and dividends.
Statement of Cash Flows: Details cash inflows and outflows from operating, investing, and financing activities.
Balance Sheet (Statement of Financial Position)
The Balance Sheet provides a summary of what the company owns (assets), owes (liabilities), and the residual interest of shareholders (equity) at a specific date. The fundamental equation is:
Example: Vodafone Group Plc Balance Sheet for 2012 and 2011
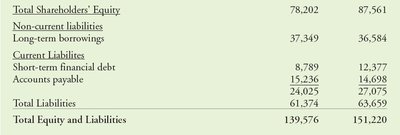
Total Shareholders' Equity: £78,202m (2012), £87,561m (2011)
Total Liabilities: £61,374m (2012), £63,659m (2011)
Total Equity and Liabilities: £139,576m (2012), £151,220m (2011)
Income Statement
The Income Statement (or Profit & Loss Statement) reports a company's financial performance over a period, detailing revenues, expenses, and resulting net income. Key components include gross profit, operating income, and net income.
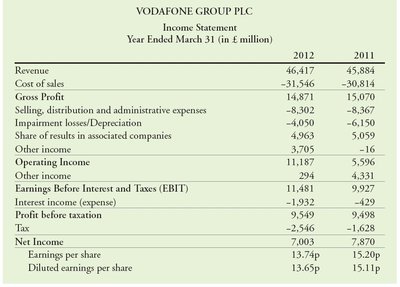
Revenue: £46,417m (2012), £45,884m (2011)
Gross Profit: £14,871m (2012), £15,070m (2011)
Operating Income: £11,187m (2012), £9,566m (2011)
Net Income: £7,003m (2012), £7,870m (2011)
Formula for Net Operating Profit After Taxes (NOPAT):
Where EBIT is Earnings Before Interest and Taxes, and T is the tax rate.
Statement of Cash Flows
The Statement of Cash Flows explains the changes in cash and cash equivalents during a period, categorized into operating, investing, and financing activities. It is crucial because net income does not always reflect actual cash generated.
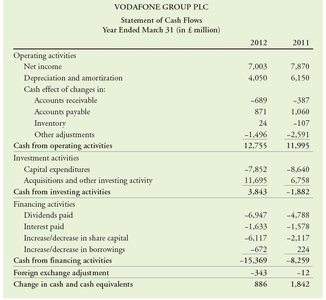
Operating Activities: Cash generated from core business operations (e.g., net income, adjustments for non-cash items like depreciation).
Investing Activities: Cash used for or generated from investments in assets (e.g., capital expenditures, acquisitions).
Financing Activities: Cash flows from transactions with shareholders and creditors (e.g., dividends, borrowing, repayment of debt).
Key Cash Flow Measures:
Operating Cash Flow (OCF):
Free Cash Flow (FCF):
Sources and Uses of Corporate Cash
Understanding the sources and uses of cash helps in analyzing a company's liquidity and financial flexibility.
Sources of Cash | Uses of Cash |
|---|---|
Decrease in any asset | Increase in any asset |
Increase in any liability | Decrease in any liability |
Net profits after taxes | Net loss |
Depreciation and other non-cash charges | Dividends paid |
Sale of stock | Repurchase or retirement of stock |
Accounting Profit vs. Cash Flow
Accounting profit is based on accrual accounting and may not reflect the actual cash position due to timing differences and non-cash items. Cash flow is a more direct measure of liquidity and financial health.
Accrual accounting focuses on when revenues and expenses are recognized, not when cash is received or paid.
Finance emphasizes the timing of cash flows, as only cash can be used to pay obligations.
Valuation and Cash Flows
The value of an investment depends on three aspects of cash flows:
Amount: Higher expected cash flows increase value.
Timing: Sooner cash flows are more valuable due to the time value of money.
Risk: Less risky cash flows are preferred.
Cost of Capital
The cost of capital is the minimum return required by providers of finance. It includes:
Cost of Debt: Minimum required return for debt holders.
Cost of Equity: Minimum required return for equity holders.
Weighted Average Cost of Capital (WACC): Average rate of return required by all investors.
Factors affecting the cost of money include time preferences, risk, expected inflation, capital structure, interest rates, and production opportunities.
Value of the Firm and Equity
The Value of the Firm is the total value of all securities issued (debt, equity, etc.), equivalent to the value of net assets. The Value of Equity considers only the equity portion, excluding debt and other non-equity securities.
