 Indietro
Chapter 1: Matter, Measurement, and Problem Solving – Study Notes
Guida di studio - Note intelligenti
 Appunti personalizzati basati sui tuoi materiali, ampliati con definizioni chiave, esempi e contesto.
Matter, Measurement, and Problem Solving
Introduction to Chemistry
Chemistry is the science that seeks to understand the behavior of matter by studying the properties and interactions of atoms and molecules. Atoms are the smallest units of matter that retain the properties of an element, and they can combine to form molecules, which are groups of atoms bonded together.
Classification of Matter
By Composition
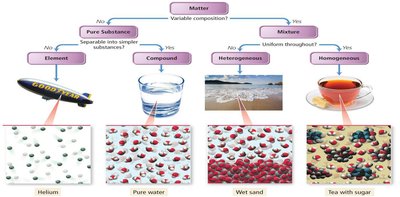
Matter can be classified based on its composition and physical state. The main categories are elements, compounds, and mixtures.
Element: A pure substance made up of only one kind of atom (e.g., copper metal, Cu).
Compound: A pure substance composed of two or more different elements chemically bonded (e.g., water, H2O).
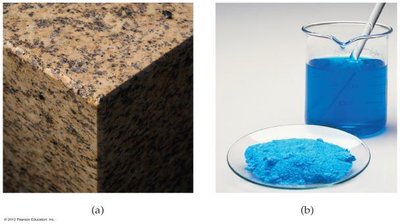
Mixture: A combination of two or more substances that are not chemically bonded. Mixtures can be homogeneous (uniform throughout, also called solutions) or heterogeneous (not uniform).
By Physical State
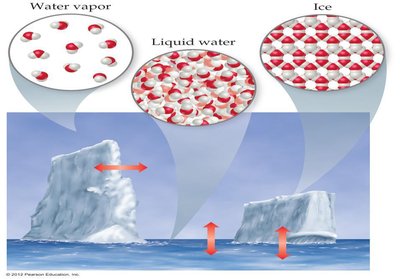
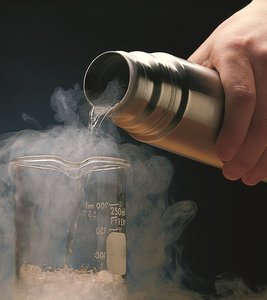
Matter exists in three primary states: solid, liquid, and gas. Each state is characterized by the arrangement and movement of its particles.
Solid: Definite shape and volume; particles are closely packed in a fixed arrangement.
Liquid: Definite volume but no definite shape; particles are close but can move past one another.
Gas: No definite shape or volume; particles are far apart and move freely.
Physical and Chemical Changes
Physical Changes
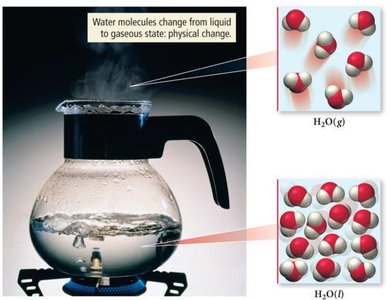
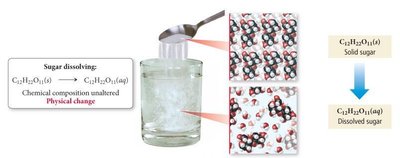
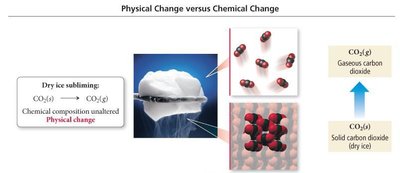
Physical changes alter the appearance or state of matter without changing its composition. Examples include changes of state (melting, boiling, condensation, freezing, sublimation, deposition) and dissolving substances in water.
Phase changes are physical changes, not chemical reactions.
Example: Boiling water – H2O(l) → H2O(g)
Chemical Changes
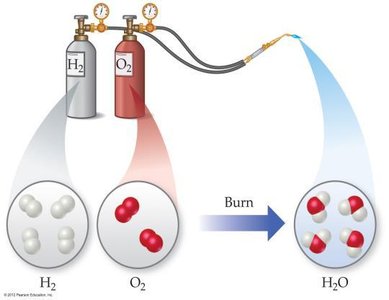
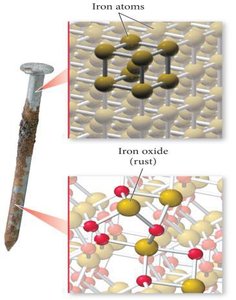
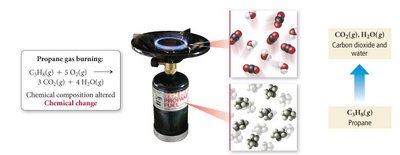
Chemical changes (chemical reactions) result in the formation of new substances with different compositions and properties. Atoms are rearranged during these processes.
Example: Combustion of hydrogen gas – 2H2 + O2 → 2H2O
Example: Rusting of iron – iron reacts with oxygen to form iron oxide (rust).
Units of Measurement and the Metric System
SI Base Units
The International System of Units (SI) is used in science for consistency. Common base units include:
Meter (m): Length
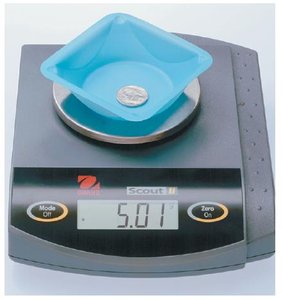
Kilogram (kg): Mass
Second (s): Time
Liter (L): Volume (1 L = 1 dm3)

Metric Prefixes
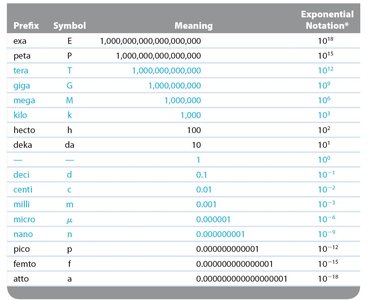
Metric prefixes indicate multiples or fractions of base units. Memorizing common prefixes is essential for unit conversions.
Prefix | Symbol | Meaning | Exponential Notation |
|---|---|---|---|
kilo | k | 1,000 | 103 |
centi | c | 0.01 | 10-2 |
milli | m | 0.001 | 10-3 |
micro | μ | 0.000001 | 10-6 |
nano | n | 0.000000001 | 10-9 |
mega | M | 1,000,000 | 106 |
Volume and Its Relationship to Length
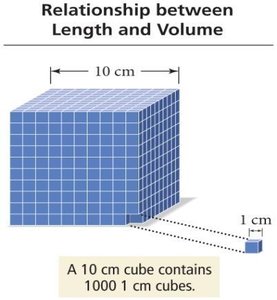
Volume is a derived unit, calculated as length cubed. For example, 1 cm3 = 1 mL, and 1 dm3 = 1 L.
Temperature Scales
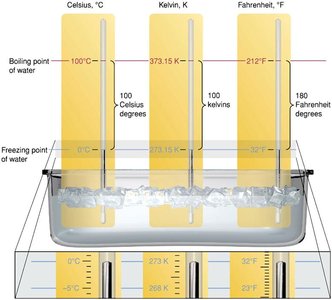
Temperature is measured in Celsius (°C), Kelvin (K), and Fahrenheit (°F). The Kelvin scale is the SI unit for temperature.
Conversion formulas:
Significant Figures and Measurement Precision
Significant Figures
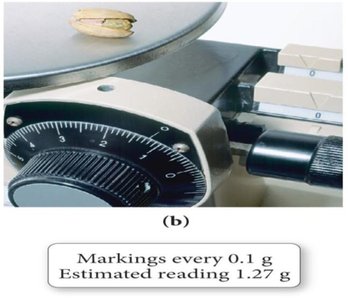
Significant figures (sig figs) reflect the precision of a measured quantity. The rules for determining significant figures are:
All nonzero digits are significant.
Zeros between nonzero digits are significant.
Leading zeros are not significant.
Trailing zeros are significant only if a decimal point is present.
Exact numbers (from counting or definitions) have infinite significant figures.
Significant Figures in Calculations
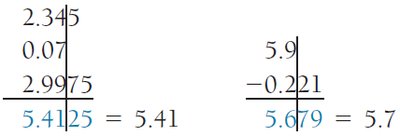
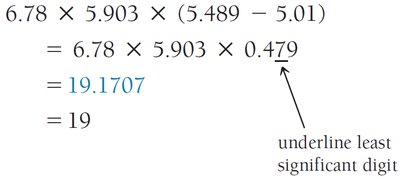
Multiplication/Division: The result has the same number of significant figures as the factor with the fewest significant figures.
Addition/Subtraction: The result has the same number of decimal places as the quantity with the fewest decimal places.

Accuracy vs. Precision
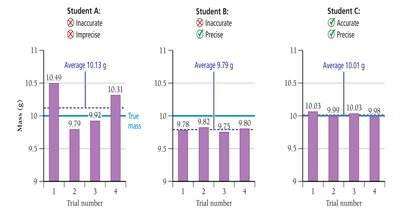
Accuracy refers to how close a measured value is to the true value. Precision refers to how close repeated measurements are to each other.
Dimensional Analysis (Unit Conversions)
Dimensional analysis is a systematic approach to problem solving that uses conversion factors to move from one unit to another. The general form is:
Information given × conversion factor(s) = information sought
Always include units in calculations and cancel them algebraically.
Derived Units: Density
Density is a physical property defined as mass per unit volume. It is an intensive property, meaning it does not depend on the amount of substance.
Formula:
Common units: g/cm3, g/mL, kg/m3
Density can be used as a conversion factor between mass and volume.
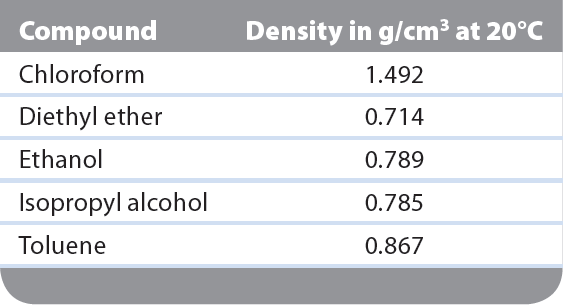
Compound | Density in g/cm3 at 20°C |
|---|---|
Chloroform | 1.492 |
Diethyl ether | 0.714 |
Ethanol | 0.789 |
Isopropyl alcohol | 0.785 |
Toluene | 0.867 |
Interpreting Graphs and Data
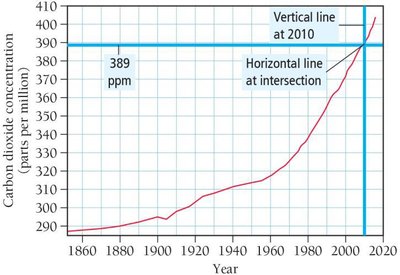
Analyzing data and interpreting graphs are essential scientific skills. For example, the concentration of atmospheric CO2 has increased over time, as shown in the graph below.
Summary Table: Classification of Matter
Type | Description | Example |
|---|---|---|
Element | Made of identical atoms | Helium gas |
Compound | Atoms of different elements bonded | Water (H2O) |
Homogeneous Mixture | Uniform composition | Salt water |
Heterogeneous Mixture | Non-uniform composition | Granite |
Additional info: These notes provide a comprehensive overview of the foundational concepts in general chemistry, including matter classification, physical and chemical changes, measurement, significant figures, and dimensional analysis. Mastery of these topics is essential for success in all subsequent chemistry coursework.
