 Indietro
Step-by-Step Guidance for Chemistry 1A Exam 1 Study Guide
Guida di studio - Note intelligenti
 Appunti personalizzati basati sui tuoi materiali, ampliati con definizioni chiave, esempi e contesto.
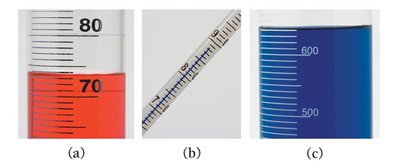
Q2. Read each measurement in the images below to the correct number of significant figures.
Background
Topic: Significant Figures and Measurement
This question tests your ability to correctly interpret measurements from laboratory glassware and record them with the appropriate number of significant figures, which is essential for accuracy in scientific data.
Key Terms:
Significant Figures: The digits in a measurement that are known with certainty plus one digit that is estimated.
Meniscus: The curve seen at the surface of a liquid in response to its container; measurements should be read at the bottom of the meniscus.
Graduated Cylinder, Thermometer, Beaker: Common laboratory glassware used for measuring volume and temperature.
Step-by-Step Guidance
Examine each image carefully and identify the type of glassware and the scale increments (e.g., 1 mL, 0.1 °C, 100 mL).
For each measurement, determine the smallest division on the scale. This will help you decide how many digits to record.
Read the measurement at the bottom of the meniscus for liquids, and estimate one digit beyond the smallest marked division.
Record the measurement with all certain digits plus one estimated digit, ensuring the correct number of significant figures.
Repeat this process for each image (a, b, c), noting the differences in scale and precision.
Try solving on your own before revealing the answer!
Final Answer:
a) 72.0 mL (3 significant figures)
b) 8.72 °C (3 significant figures)
c) 610 mL (2 significant figures)
Each answer reflects the correct number of significant figures based on the precision of the instrument and the scale divisions.
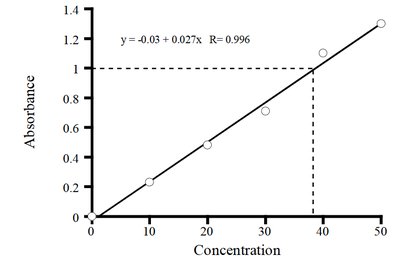
Q4. From the graph, estimate the concentration of the solution which shows an absorbance value of 0.4.
Background
Topic: Standard Curves and Data Analysis
This question tests your ability to use a standard curve to estimate the concentration of a solution based on its absorbance, a common technique in quantitative analysis.
Key Terms and Formula:
Standard Curve: A plot of absorbance versus concentration for a series of known standards.
Absorbance (A): The amount of light absorbed by a sample.
Concentration (C): The amount of solute in a given volume of solution.
Linear Equation:
Step-by-Step Guidance
Identify the equation of the line from the graph: .
Set the absorbance value to 0.4: .
Substitute into the equation and solve for (concentration).
Rearrange the equation: .
Isolate and set up the calculation for the student to complete.
Try solving on your own before revealing the answer!
Final Answer:
mg/dL
The concentration corresponding to an absorbance of 0.4 is approximately 15.9 mg/dL, based on the linear equation from the standard curve.
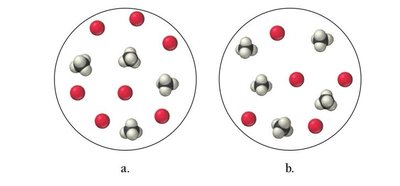
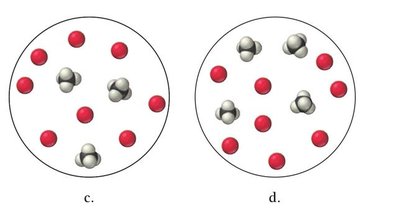
Q9. Gaseous methane reacts with oxygen to form carbon dioxide and water vapor. Write a balanced equation for the combustion reaction and determine which mixture in the figures below has neither reactant in excess.
Background
Topic: Chemical Reactions and Stoichiometry
This question tests your ability to write balanced chemical equations and use stoichiometric relationships to identify limiting and excess reactants in a mixture.
Key Terms and Formula:
Balanced Equation: Shows the reactants and products with correct stoichiometric coefficients.
Limiting Reactant: The reactant that is completely consumed in a reaction.
Stoichiometry: The calculation of reactant and product quantities in chemical reactions.
Step-by-Step Guidance
Write the balanced equation for methane combustion: .
For each diagram (a, b, c, d), count the number of methane () and oxygen () molecules.
Determine the ratio of methane to oxygen in each mixture and compare it to the stoichiometric ratio (1:2).
Identify which mixture has exactly the required ratio, meaning neither reactant is in excess.
Set up the comparison for the student to complete, stopping before stating which diagram is correct.
Try solving on your own before revealing the answer!
Final Answer:
Mixture (c) has neither reactant in excess. It contains 2 methane molecules and 4 oxygen molecules, matching the 1:2 ratio required by the balanced equation.
This ensures all reactants are used up with no excess.
