 Indietro
Thermochemistry and Electronic Structure: Study Notes for General Chemistry
Guida di studio - Note intelligenti
 Appunti personalizzati basati sui tuoi materiali, ampliati con definizioni chiave, esempi e contesto.
Enthalpy of Reaction and Thermochemistry
Exothermic Polymerization and Industrial Hazards
The enthalpy of reaction is a key concept in thermochemistry, describing the heat change during a chemical reaction at constant pressure. Exothermic reactions, such as the polymerization of styrene, can release large amounts of heat, leading to industrial hazards like runaway reactions and explosions. Understanding the enthalpy change is crucial for safety and process control.
Exothermic Reaction: Releases heat to the surroundings; ΔH is negative.
Styrene Polymerization: Highly exothermic and catalyzed by air exposure, which can cause overheating and venting.
Boiling Point: Styrene boils at 145°C, but exothermic reactions can cause boiling at lower temperatures due to heat release.
Industrial Example: Tank car venting styrene and water being sprayed to cool and prevent explosion.

Calculating Enthalpy Change (ΔH) Using Standard Enthalpy Values
Standard enthalpy values (ΔH°) are used to calculate the enthalpy change for a reaction. The enthalpy of reaction is determined by subtracting the sum of the enthalpies of formation of the reactants from those of the products.
Formula:
Example Reaction: Ca(OH)2(s) + CO2(g) → CaCO3(s) + H2O(g)
Calculation: Using standard enthalpy values, ΔHrxn° = -69.1 kJ
Stoichiometry and Heat Calculation
Stoichiometry allows calculation of the total heat generated or required in a reaction based on the mass of reactants.
Example: 1.00 kg Ca(OH)2 yields approximately -932 kJ of heat in the reaction above.
Steps: Convert mass to moles, then multiply by ΔH per mole.
Bond Enthalpy and Enthalpy of Reaction
Bond enthalpy is the energy required to break one mole of a specific bond in a gaseous molecule. It is always positive, as breaking bonds requires energy. The greater the bond enthalpy, the stronger the bond. Energy is released when bonds form.
Bond Enthalpy Table: Provides average bond energies for common bonds (see below).
Calculation: Estimate ΔHrxn by summing bond energies for bonds broken and subtracting those for bonds formed.
Formula:
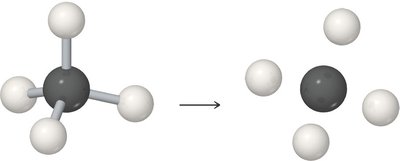

Bond Enthalpy Table (Main Purpose: Reference for Calculations)
Bond | Bond Enthalpy (kJ/mol) |
|---|---|
C–H | 413 |
C–C | 348 |
C=C | 614 |
C–N | 293 |
C–O | 358 |
C=O | 799 |
O–H | 463 |
H–H | 436 |
N–H | 391 |
F–F | 155 |
Cl–Cl | 242 |
Br–Br | 193 |
I–I | 151 |
Additional info: Table values are averages and may vary slightly depending on molecular context.
Bond Enthalpy and Reaction Enthalpy Example
To estimate the enthalpy change for a reaction:
Add bond energies for all bonds broken (energy input).
Subtract bond energies for all bonds formed (energy released).
The result is an estimate of ΔHrxn.

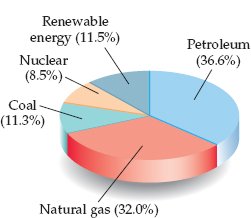
Energy Content of Foods and Fuels
Metabolism and Combustion
The energy content of foods and fuels is closely related to their enthalpy of combustion. Carbohydrates and fats provide similar energy values to their heat of combustion, while proteins are similar in nutritional energy per gram to carbohydrates.
Carbohydrates: ~17 kJ/g
Fats: ~38 kJ/g
Proteins: ~17 kJ/g
Example Combustion: for glucose
Energy Content of Foods Table (Main Purpose: Comparison of Nutritional Values)
Food | Carbohydrate (%) | Fat (%) | Protein (%) | Fuel Value (kJ/g) | Fuel Value (kcal/g) |
|---|---|---|---|---|---|
Carbohydrate | 100 | 17 | 4 | ||
Fat | 100 | 38 | 9 | ||
Protein | 100 | 17 | 4 | ||
Apples | 13 | 0.5 | 0.4 | 2.5 | 0.59 |
Bread | 52 | 3 | 9 | 12 | 2.8 |
Cheese | 4 | 37 | 28 | 20 | 4.7 |
Eggs | 0.7 | 10 | 13 | 6.0 | 1.4 |
Fudge | 81 | 11 | 2 | 18 | 4.4 |
Green beans | 7.0 | 1.9 | 1.5 | 0.38 | |
Hamburger | 30 | 22 | 15 | 3.6 | |
Milk (whole) | 5.0 | 4.0 | 3.3 | 3.0 | 0.74 |
Peanuts | 22 | 39 | 26 | 23 | 5.5 |
Energy Content of Fuels Table (Main Purpose: Comparison of Fuel Values)
Fuel | C (%) | H (%) | O (%) | Fuel Value (kJ/g) |
|---|---|---|---|---|
Wood (pine) | 50 | 6 | 44 | 18 |
Anthracite coal | >82 | 1 | 2 | 31 |
Bituminous coal | 77 | 5 | 7 | 32 |
Charcoal | 100 | 0 | 0 | 34 |
Crude oil | 85 | 12 | 0 | 45 |
Gasoline | 85 | 15 | 0 | 48 |
Natural gas | 70 | 23 | 0 | 49 |
Ethanol | 52 | 13 | 35 | 30 |
Hydrogen | 0 | 100 | 0 | 142 |
Electronic Structure of Atoms
Wave Nature of Light
Light is a form of electromagnetic radiation, consisting of oscillating electric and magnetic fields perpendicular to each other. All electromagnetic waves travel at the speed of light in a vacuum, which is m/s.
Electric Field: Region where charged particles experience force.
Magnetic Field: Region where magnetized particles experience force.

Characterizing Electromagnetic Waves
Electromagnetic waves are characterized by amplitude and wavelength. The amplitude is related to the intensity of light, while the wavelength determines the color and other properties.
Amplitude: Height of the wave; larger amplitude means brighter light.
Wavelength (λ): Distance between repeating points (e.g., troughs or crests).

Relationship Between Wavelength and Frequency
The frequency (ν) of a wave is the number of oscillations per second. For electromagnetic waves, wavelength and frequency are inversely proportional, since the speed of light is constant.
Formula:
Units: Hertz (Hz), where 1 Hz = 1 s−1
Shorter Wavelength: Higher frequency
Color and the Electromagnetic Spectrum
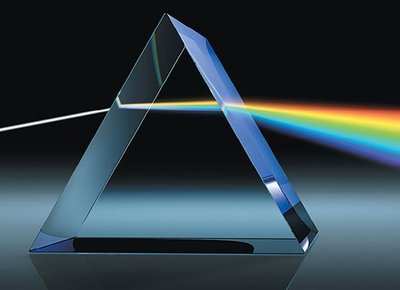
The color of visible light is determined by its wavelength. White light is a mixture of all visible wavelengths. Objects appear colored based on which wavelengths they reflect or absorb.
Visible Spectrum: Range of wavelengths visible to the human eye.
Absorption and Reflection: Determines perceived color.

Wave-Particle Duality and Interference
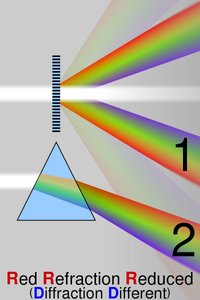
Light exhibits both wave-like and particle-like properties. Interference occurs when waves overlap, resulting in constructive (in phase) or destructive (out of phase) patterns. Diffraction is the bending of waves around obstacles or through slits, producing characteristic interference patterns.
Constructive Interference: Waves add to make a larger wave.
Destructive Interference: Waves cancel each other.
Diffraction: Bending of waves around barriers or through slits.

Quantization and Atomic Spectra
Energy in atoms is quantized, meaning electrons can only occupy specific energy levels. When excited, atoms emit light at characteristic wavelengths, producing atomic emission spectra. The Rydberg equation describes the wavelengths of hydrogen's emission lines.
Rydberg Equation: , where m−1
Bohr Model: Electrons travel in quantized orbits; energy is related to orbit distance.
Energy Change:
Photoelectric Effect and Photons
The photoelectric effect demonstrates the particle nature of light. Electrons are emitted from metal surfaces when irradiated with light above a threshold frequency. Einstein explained this by proposing that light energy is delivered in packets called photons.
Photon Energy:
Planck's Constant: J·s
Workfunction: Minimum energy required to eject an electron from a metal.
Wave Behavior of Matter (de Broglie Wavelength)
Electrons and other particles exhibit wave-like behavior, described by the de Broglie wavelength.
de Broglie Wavelength: , where is momentum ( for non-relativistic speeds)
Applications: Electron diffraction patterns, nanomaterials
Additional info: Quantum mechanics further explains atomic orbitals, electron configurations, and periodic trends, which are covered in subsequent chapters.
