Referring to Figure 11.29, describe the phase changes (and the temperatures at which they occur) when CO2 is heated from -80 to -20°C at (a) a constant pressure of 3 atm,
Ch.11 - Liquids and Intermolecular Forces
Brown14th EditionChemistry: The Central ScienceISBN: 9780134414232Non è quello che usi tu?Cambia libro di testo
Capitolo 11, Problema 62a
Use the phase diagram of neon to answer the following questions. (a) What is the approximate value of the normal boiling point?
Guida verificata passo dopo passo1
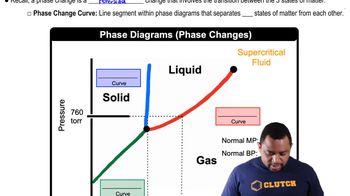
Understand the concept of a phase diagram: A phase diagram is a graphical representation of the physical states of a substance under different conditions of temperature and pressure. It typically includes lines that separate different phases such as solid, liquid, and gas.
Identify the normal boiling point: The normal boiling point is the temperature at which a substance transitions from liquid to gas at 1 atmosphere of pressure.
Locate the phase diagram for neon: You will need to refer to a phase diagram specific to neon, which shows the relationship between temperature and pressure for its different phases.
Find the point on the phase diagram where the liquid-gas boundary intersects with the line representing 1 atmosphere of pressure. This intersection point indicates the normal boiling point of neon.
Read the temperature value at this intersection: The temperature at this point on the phase diagram is the approximate value of the normal boiling point of neon.

Risposta video verificata per un problema simile:
Questa soluzione video è stata consigliata dai nostri tutor come utile per risolvere questo problema.
Durata del video:
2mConcetti chiave
Ecco i concetti essenziali che devi comprendere per rispondere correttamente alla domanda.
Phase Diagram
A phase diagram is a graphical representation that shows the states of a substance (solid, liquid, gas) at various temperatures and pressures. It helps in understanding the conditions under which a substance will exist in different phases and indicates critical points, such as the boiling point and melting point.
Video consigliato:
Percorso guidato
Phase Changes in Diagrams
Normal Boiling Point
The normal boiling point of a substance is the temperature at which it transitions from a liquid to a gas at a pressure of 1 atmosphere (atm). This value is significant as it provides insight into the substance's volatility and intermolecular forces, with lower boiling points indicating weaker forces.
Video consigliato:
Percorso guidato
Boiling Point Elevation
Intermolecular Forces
Intermolecular forces are the forces of attraction or repulsion between molecules. They play a crucial role in determining the physical properties of substances, including boiling and melting points. In the case of neon, a noble gas, the weak London dispersion forces influence its phase transitions.
Video consigliato:
Percorso guidato
Intermolecular vs Intramolecular Forces
Pratica correlata
Domanda del libro di testo
1224
views
Domanda del libro di testo
(b) Could you measure the triple point of water by measuring the temperature in a vessel in which water vapor, liquid water, and ice are in equilibrium under 1 atm of air? Explain.
690
views
Domanda del libro di testo
Use the phase diagram of neon to answer the following questions. (b) What can you say about the strength of the intermolecular forces in neon and argon based on the critical points of Ne and Ar (see Table 11.5.)?
687
views
Domanda del libro di testo
At 25 °C gallium is a solid with a density of 5.91 g/cm3. Its melting point, 29.8 °C, is low enough that you can melt it by holding it in your hand. The density of liquid gallium just above the melting point is 6.1 g/cm3. Based on this information, what unusual feature would you expect to find in the phase diagram of gallium?
1214
views
Domanda del libro di testo
The phase diagram for neon is
Use the phase diagram to answer the following questions. (a) What is the approximate value of the normal melting point?
1268
views