Ch.11 - Liquids and Intermolecular Forces
Brown - Chemistry: The Central Science 15th Edition
Brown15th EditionChemistry: The Central ScienceISBN: 9780137542970Non è quello che usi tu?Cambia libro di testo
Capitolo 11, Problema 90

A particular liquid crystalline substance has the phase diagram shown in the figure. By analogy with the phase diagram for a nonliquid crystalline substance, identify the phase present in each area.

Guida verificata passo dopo passo
1
Identify the axes of the phase diagram. Typically, the x-axis represents temperature and the y-axis represents pressure.
Locate the different regions or areas on the phase diagram. Each region corresponds to a different phase of the substance.
Identify the phase boundaries, which are the lines separating different regions. These lines indicate the conditions under which two phases coexist in equilibrium.
Determine the phases present in each region by comparing the phase diagram to a typical phase diagram for a nonliquid crystalline substance. Common phases include solid, liquid, and gas, but liquid crystalline substances may have additional phases such as nematic, smectic, or cholesteric.
Label each region with the appropriate phase name based on the characteristics of liquid crystalline substances and the analogy to nonliquid crystalline phase diagrams.

Risposta video verificata per un problema simile:

Questa soluzione video è stata consigliata dai nostri tutor come utile per risolvere questo problema.
Durata del video:
58s

Concetti chiave

Ecco i concetti essenziali che devi comprendere per rispondere correttamente alla domanda.

Phase Diagrams

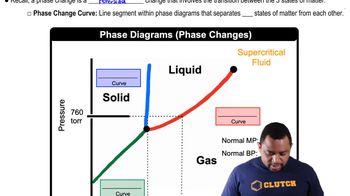
Phase diagrams are graphical representations that show the phases of a substance as a function of temperature and pressure. They illustrate the conditions under which distinct phases, such as solid, liquid, and gas, exist and transition into one another. Understanding phase diagrams is crucial for predicting the state of a substance under varying environmental conditions.
Video consigliato:
Percorso guidato
03:22
Phase Changes in Diagrams

Liquid Crystals

Liquid crystals are materials that exhibit properties between those of conventional liquids and solid crystals. They can flow like a liquid but have some degree of order, typically in their molecular arrangement. This unique behavior allows them to respond to electric fields and temperature changes, making them important in applications like displays and sensors.
Video consigliato:
Percorso guidato
03:04
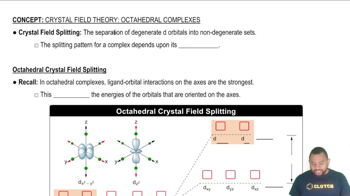
The crystal field splitting pattern for octahedral complexes has the d orbitals on or along the axes as having the higher energy.

Phase Transitions

Phase transitions refer to the changes in the state of matter that occur when a substance absorbs or releases energy, typically in the form of heat. Common transitions include melting, freezing, boiling, and condensation. In the context of liquid crystals, understanding these transitions is essential for identifying the different phases represented in a phase diagram.
Video consigliato:
Percorso guidato
03:22
Phase Changes in Diagrams
Pratica correlata
Domanda del libro di testo

Naphthalene (C10H8) is the main ingredient in traditional mothballs. Its normal melting point is 81 °C, its normal boiling point is 218 °C, and its triple point is 80 °C at 1000 Pa. Using the data, construct a phase diagram for naphthalene, labeling all the regions of your diagram.

2401
views
Domanda del libro di testo

The vapor pressure of ethanol (C2H5OH) at 19 °C is 40.0 torr. A 1.00-g sample of ethanol is placed in a 2.00 L container at 19 °C. If the container is closed and the ethanol is allowed to reach equilibrium with its vapor, how many grams of liquid ethanol remain?

1363
views
Domanda del libro di testo

Using information in Appendices B and C, calculate the minimum grams of propane, C3H8(g), that must be combusted to provide the energy necessary to convert 5.50 kg of ice at -20 °C to liquid water at 75 °C

789
views
Domanda del libro di testo

Suppose the vapor pressure of a substance is measured at two different temperatures.

a. By using the Clausius–Clapeyron equation (Equation 11.1), derive the following relationship between the vapor pressures, 𝑃1 and 𝑃2, and the absolute temperatures at which they were measured, 𝑇1 and 𝑇2:

ln𝑃1𝑃2=−Δ𝐻vap𝑅(1𝑇1−1𝑇2)

b. Gasoline is a mixture of hydrocarbons, a component of which is octane (CH3CH2CH2CH2CH2CH2CH2CH3). Octane has a vapor pressure of 13.95 torr at 25°C and a vapor pressure of 144.78 torr at 75°C. Use these data and the equation in part (a) to calculate the heat of vaporization of octane.

c. By using the equation in part (a) and the data given in part (b), calculate the normal boiling point of octane. Compare your answer to the one you obtained from Exercise 11.83.

d. Calculate the vapor pressure of octane at −30°C.

1
views
Domanda del libro di testo

In Table 11.3, we saw that the viscosity of a series of hydrocarbons increased with molecular weight, doubling from the six-carbon molecule to the ten-carbon molecule.

(a) The eight-carbon hydrocarbon, octane, has an isomer, isooctane. Would you predict that isooctane would have a larger or smaller viscosity than octane? Why?

530
views
Domanda del libro di testo

The following table gives the vapor pressure of hexafluorobenzene (C6F6) as a function of temperature: (a) By plotting these data in a suitable fashion, determine whether the Clausius–Clapeyron equation (Equation 11.1) is obeyed. If it is obeyed, use your plot to determine ∆Hvap for C6F6.

576
views