Ch.11 - Liquids & Phase Changes
McMurry - Chemistry 8th Edition
McMurry8th EditionChemistryISBN: 9781292336145Non è quello che usi tu?Cambia libro di testo
Capitolo 11, Problema 62

Benzene has a melting point of 5.53 °C and a boiling point of 80.09 °C at atmospheric pressure. Its density is0.8787 g>cm3 when liquid and 0.899 g>cm3 when solid; it has Tc = 289.01 °C, Pc = 48.34 atm, Tt = 5.52 °C, and Pt = 0.0473 atm. Starting from a point at 200 K and 66.5 atm, trace the following path on a phase diagram. (1) First, increase T to 585 K while keeping P constant. (2) Next, decrease P to 38.5 atm while keeping T constant. (3) Then, decrease T to 278.66 K while keeping P constant. (4) Finally, decrease P to 0.0025 atm while keeping T constant. What is your starting phase, and what is your final phase?

Guida verificata passo dopo passo
1
Identify the starting point on the phase diagram: At 200 K and 66.5 atm, determine the phase of benzene by comparing these conditions to the known triple point (Tt = 5.52 °C or 278.67 K, Pt = 0.0473 atm) and critical point (Tc = 289.01 °C or 562.16 K, Pc = 48.34 atm).
Step 1: Increase the temperature to 585 K while keeping the pressure constant at 66.5 atm. Determine the phase by checking if this temperature is above the critical temperature (Tc = 289.01 °C or 562.16 K), which would indicate a supercritical fluid.
Step 2: Decrease the pressure to 38.5 atm while keeping the temperature constant at 585 K. Since the temperature is still above the critical temperature, the phase remains a supercritical fluid.
Step 3: Decrease the temperature to 278.66 K while keeping the pressure constant at 38.5 atm. Compare this temperature and pressure to the triple point to determine if the phase is solid, liquid, or gas.
Step 4: Finally, decrease the pressure to 0.0025 atm while keeping the temperature constant at 278.66 K. Compare these conditions to the triple point to determine the final phase, likely transitioning to a gas if below the triple point pressure.

Risposta video verificata per un problema simile:

Questa soluzione video è stata consigliata dai nostri tutor come utile per risolvere questo problema.
Durata del video:
4m

Concetti chiave

Ecco i concetti essenziali che devi comprendere per rispondere correttamente alla domanda.

Phase Diagrams

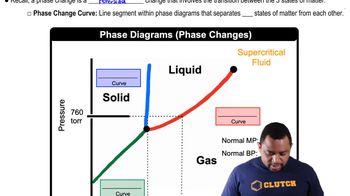
Phase diagrams are graphical representations that show the state of a substance (solid, liquid, or gas) at various temperatures and pressures. They help visualize the conditions under which different phases coexist and transition into one another. Understanding how to read and interpret phase diagrams is crucial for predicting the behavior of substances like benzene under varying temperature and pressure conditions.
Video consigliato:
Percorso guidato
03:22
Phase Changes in Diagrams

Critical Point

The critical point of a substance is the temperature and pressure at which the distinction between liquid and gas phases disappears. Beyond this point, the substance enters a supercritical state, where it exhibits properties of both phases. For benzene, the critical temperature (Tc) is 289.01 °C, and the critical pressure (Pc) is 48.34 atm, which are essential for understanding the transitions that occur during the path traced in the question.
Video consigliato:
Percorso guidato
03:05
Boiling Point Elevation

Phase Transitions

Phase transitions refer to the changes between solid, liquid, and gas states of a substance, driven by variations in temperature and pressure. Each transition, such as melting, boiling, or sublimation, occurs at specific conditions. In the context of the question, tracking the changes in temperature and pressure allows us to determine the starting and final phases of benzene as it undergoes these transitions.
Video consigliato:
Percorso guidato
03:22
Phase Changes in Diagrams