 Indietro
CHAP 5: Genetic Linkage and Mapping in Eukaryotes
Guida di studio - Note intelligenti
 Appunti personalizzati basati sui tuoi materiali, ampliati con definizioni chiave, esempi e contesto.
Genetic Linkage and Mapping in Eukaryotes
Introduction
Genetic linkage and mapping are fundamental concepts in genetics, describing how genes located close together on the same chromosome are inherited together and how their positions can be determined using recombination frequencies. This study guide covers the principles, experimental evidence, and methods used to analyze genetic linkage and construct genetic maps in eukaryotes.
Linked Genes and Independent Assortment
Linked Genes and Synteny
Genes located on the same chromosome are referred to as syntenic genes. When syntenic genes are close together, their alleles do not assort independently and are termed linked genes. Genetic linkage can be quantified to map gene positions.
Syntenic genes: Genes on the same chromosome.
Linked genes: Syntenic genes close enough that their alleles are inherited together.
Genetic linkage mapping: Plots gene positions based on recombination frequency.
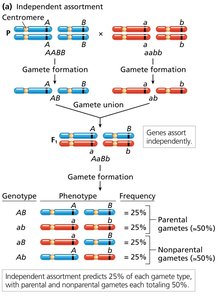
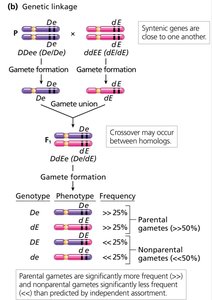
Recombination and Chromosome Behavior
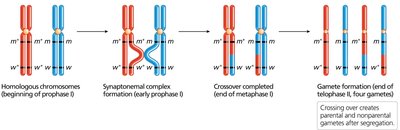
Recombination occurs when crossing over between homologous chromosomes reshuffles alleles, producing recombinant chromosomes. Chromosomes that do not undergo recombination are called parental chromosomes.
Crossing over: Occurs during prophase I of meiosis, leading to recombination.
Parental chromosomes: Chromosomes retaining original allele combinations.
Recombinant chromosomes: Chromosomes with new allele combinations due to crossing over.
Independent Assortment of Syntenic Genes
If syntenic genes are far apart, recombination occurs frequently, and they assort independently. Genes closer together tend to segregate together.
Observations and Detection of Genetic Linkage
Key Observations
Linked genes are always syntenic and located near each other.
Genetic linkage results in more parental gametes than nonparental gametes.
Crossing over is less likely between closely linked genes.
Detecting Linkage
Linkage is detected by comparing observed frequencies of gamete genotypes or progeny phenotypes with those expected under independent assortment. Linked genes show parental allele combinations at higher frequency than predicted by chance.
Gametes of Dihybrids: Unlinked vs. Linked Genes
Unlinked Genes
A dihybrid AaBb with unlinked genes produces four gamete combinations (AB, ab, Ab, aB) with equal frequency.
Linked Genes
Linked genes produce parental combinations more than 50% of the time, and nonparental combinations less than 50%.
Complete and Incomplete Genetic Linkage
Complete Genetic Linkage
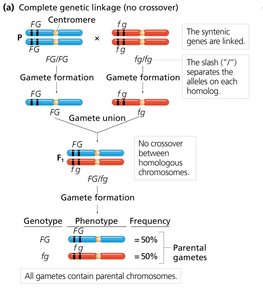
Occurs when no crossing over happens between linked genes; only parental gametes are formed. Example: Drosophila males exhibit complete linkage.
Incomplete Genetic Linkage
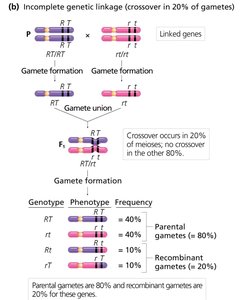
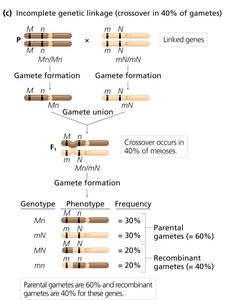
More common than complete linkage; both parental and recombinant gametes are produced. The proportion of parental to recombinant gametes varies between gene pairs.
Calculating Recombination Frequency
Definition and Formula
Recombination frequency (r) is calculated as:
Formula:
Reflects the physical distance between two genes.
Correlation Between Recombination Frequency and Gene Distance
Higher recombination frequency indicates greater distance between genes.
Lower recombination frequency indicates genes are closer together.
Experimental Evidence of Genetic Linkage
Bateson and Punnett's Sweet Pea Crosses
Crosses did not yield the expected 9:3:3:1 ratio; parental phenotypes were more frequent, indicating linkage.
Phenotype | Genotype | Number Observed | Number Expected |
|---|---|---|---|
Purple, long | P-L- | 4831 | 3910.5 |
Purple, round | P-ll | 390 | 1303.5 |
Red, long | ppL- | 393 | 1303.5 |
Red, round | ppll | 1338 | 434.5 |
Morgan's Drosophila Crosses
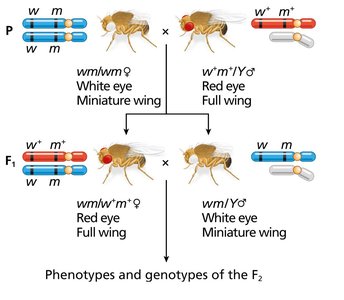
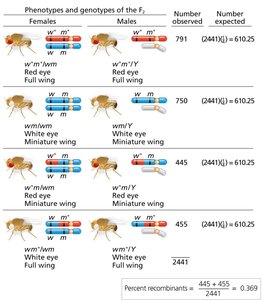
Morgan's crosses with X-linked genes (white eye and miniature wing) showed more parental types than recombinant types, confirming linkage.
Test-Cross Analysis of Autosomal Genes
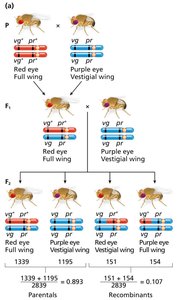
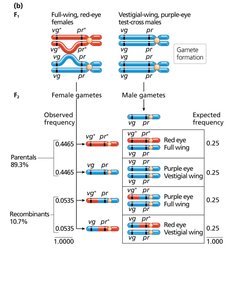
Test crosses with autosomal genes in Drosophila also revealed linkage, with parental gametes more frequent than recombinants.
Cytological Evidence of Recombination
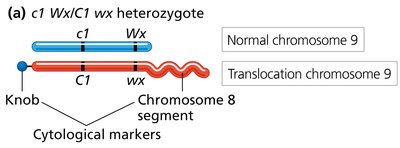
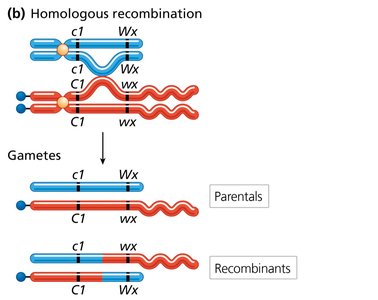
Creighton and McClintock's Corn Experiment
Direct evidence that recombination is accompanied by physical exchange between homologs was provided by cytological markers.
Genetic Linkage Mapping
Sturtevant's Linkage Map
Sturtevant used recombination frequencies to construct the first genetic map for five X-linked genes in Drosophila.
Gene Pair | Recombination Frequency (r) |
|---|---|
Yellow (y) and white (w) | 0.010 |
Yellow (y) and vermilion (v) | 0.322 |
Vermilion (v) and white (w) | 0.297 |
Vermilion (v) and miniature (m) | 0.030 |
Miniature (m) and white (w) | 0.337 |
White (w) and rudimentary (r) | 0.452 |
Rudimentary (r) and vermilion (v) | 0.269 |
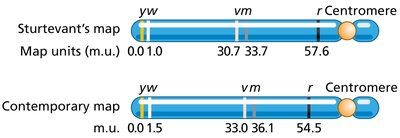
Map Units and CentiMorgans
Recombination frequencies are converted to map units (m.u.) or centiMorgans (cM).
1% recombination = 1 m.u. = 1 cM.
Chi-Square Analysis
Chi-square tests are used to determine if observed frequencies significantly deviate from expected values under independent assortment.
Formula:
Significant deviation indicates genetic linkage.
Three-Point Test-Cross Analysis
Mapping Three Linked Genes
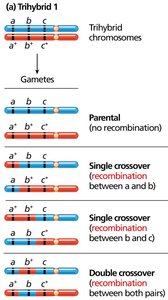
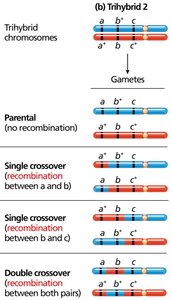
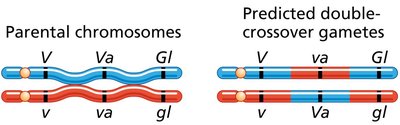
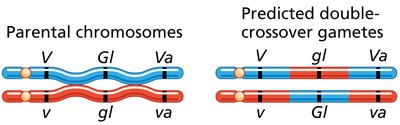
Three-point test-cross analysis allows efficient mapping of three linked genes simultaneously. Parental types are most frequent, single crossovers less frequent, and double crossovers least frequent.
Constructing a Three-Point Map
Gene order is determined by comparing parental and double-crossover genotypes. Recombination frequencies are calculated for each gene pair.
Recombination frequency (r):
Double crossovers are counted twice for the largest distance.
Interference and Coefficient of Coincidence
Interference
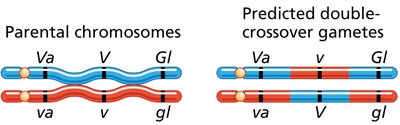
Interference occurs when the observed number of double crossovers is less than expected. The coefficient of coincidence (c) and interference (I) are calculated as:
Coefficient of coincidence:
Interference:
Predicting Gamete Frequencies from Genetic Maps
Two Genes
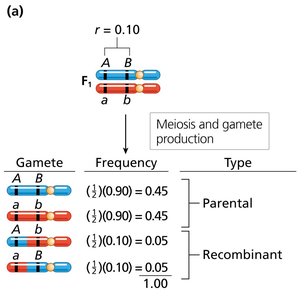
For genes A and B 10 cM apart, recombinant gametes are expected 10% of the time, parental gametes 90%.
Three Genes
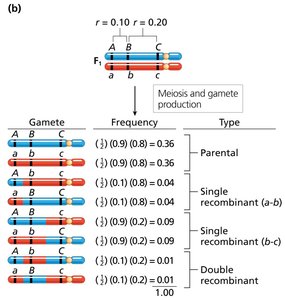
For three genes, frequencies are calculated based on map distances between each pair.
Correction of Genetic Map Distances
Mapping Functions
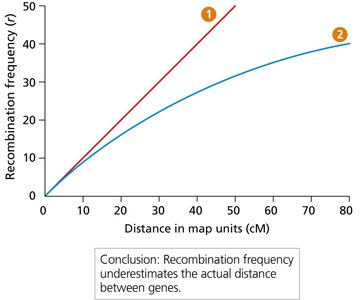
Map distances calculated from recombination frequencies underestimate physical distances, especially for genes far apart. Mapping functions (Haldane, Kosambi) correct for this.
Factors Affecting Recombination Frequency
Species, Age, Environment, and Sex
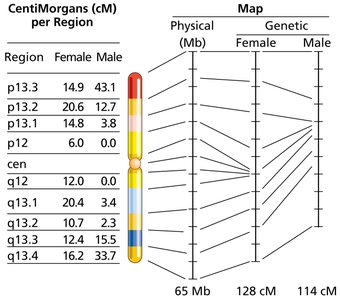
Recombination rates vary by species, age, environment, and sex.
Heterogametic sex (e.g., males in fruit flies) often has lower recombination rates.
Environmental factors (temperature, diet) can affect recombination rates.
Recombination Hotspots and Coldspots
Distribution in Genomes
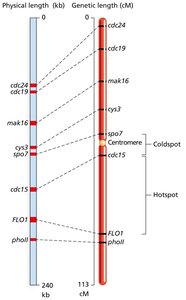
Recombination occurs at specific hotspots and coldspots, affecting genetic map distances. Hotspots are regions with high recombination rates; coldspots have low rates.
Human Gene Mapping
Specialized Methods
Human gene mapping is challenging due to limited controlled matings and small family sizes. X-linked genes were mapped first. Polymorphic DNA sequences, called genetic markers, are used to facilitate mapping.
Linkage Groups
Clusters of syntenic genes linked together are called linkage groups. Linkage between a genetic marker and a gene assigns the group to a chromosomal location.
Additional info: This guide expands on brief points with academic context, definitions, and examples to ensure completeness and clarity for exam preparation.
