 Indietro
Linkage and Chromosome Mapping in Eukaryotes: Study Guide
Guida di studio - Note intelligenti
 Appunti personalizzati basati sui tuoi materiali, ampliati con definizioni chiave, esempi e contesto.
Linkage and Chromosome Mapping in Eukaryotes
Introduction
This chapter explores the principles of genetic linkage and chromosome mapping in eukaryotes. It covers how genes located on the same chromosome are inherited together, the consequences of crossing over, and the methods used to determine gene distances and order. Understanding these concepts is fundamental for analyzing genetic inheritance patterns and constructing genetic maps.
Meiotic Consequences: Independent Assortment, Complete Linkage, and Crossing Over
During meiosis, the arrangement and segregation of genes can follow different patterns depending on their chromosomal location and proximity.
Independent Assortment: Genes located on different chromosomes assort independently, producing a variety of gamete combinations. This leads to the classic Mendelian ratio in offspring.
Complete Linkage: Genes very close together on the same chromosome are inherited as a unit, producing only parental-type gametes.
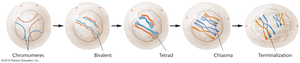
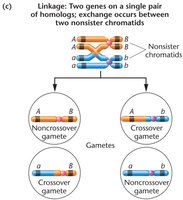
Crossing Over: Physical exchange between nonsister chromatids during prophase I of meiosis can produce recombinant gametes, reshuffling alleles.
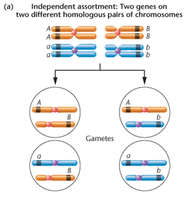
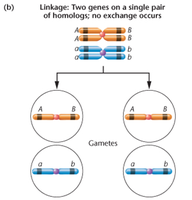
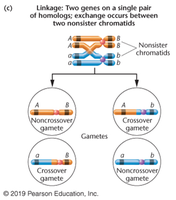
Experimental Evidence and Linkage Ratios
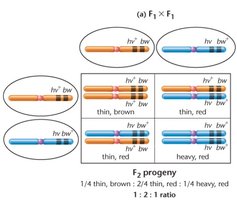
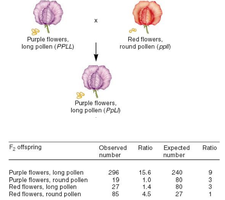
Classic experiments with sweet peas and fruit flies demonstrated that genes on the same chromosome do not always follow Mendelian ratios. Instead, linkage ratios are observed.
Linkage Ratio: The ratio of phenotypes produced from a cross between two organisms heterozygous at linked loci, often 1:2:1 for both phenotypic and genotypic ratios.
Linkage Group: Genes on the same chromosome form a linkage group; the number of linkage groups corresponds to the haploid chromosome number.
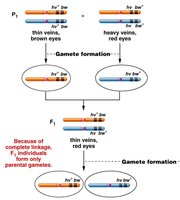
Historical Discoveries: Bateson, Punnett, and Morgan
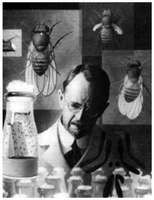
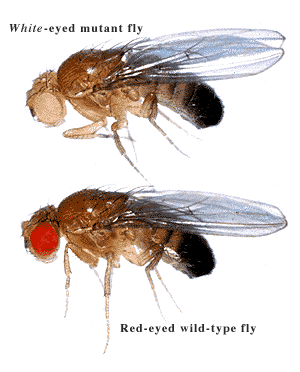
The first report of linkage came from Bateson, Saunders, and Punnett in 1905 with sweet peas. Thomas Hunt Morgan later provided experimental evidence using fruit flies, showing that parental phenotypes are more common than recombinants.
Linked Genes: Genes located close together on the same chromosome tend to be inherited together.
Recombinants: Produced by crossing-over, their frequency depends on the distance between genes.
Crossing Over and Recombination
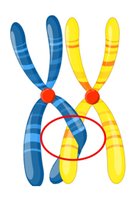
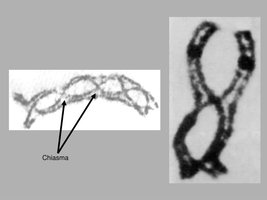
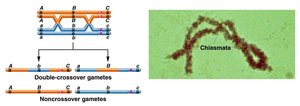
Crossing over occurs during prophase I of meiosis at the site of chiasmata, resulting in the exchange of genetic material between homologous chromosomes.
Chiasma: The physical site where crossing over occurs.
Recombination Frequency: The percentage of recombinant offspring, which correlates with the distance between genes.
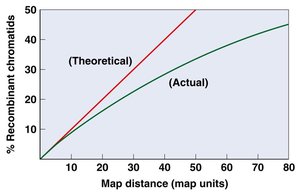
Maximum Recombination Rate: 50%—beyond this, genes appear to assort independently.
Map Units and Genetic Mapping
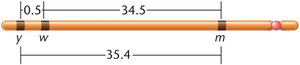
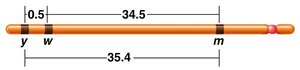
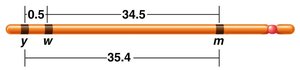
Gene distances are measured in map units (m.u.) or centiMorgans (cM), where 1 m.u. equals 1% recombination frequency. Map units are additive to a certain extent, but multiple crossovers can cause underestimation of distances.
Map Unit (m.u. or cM): 1% recombination between two genes.
Additivity: Map units are generally additive, but not strictly due to statistical and biological factors.
Single and Multiple Crossovers
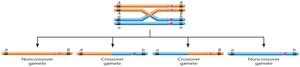
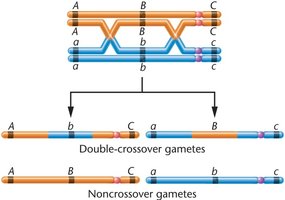
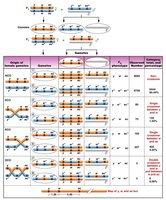
Single crossovers produce two parental and two recombinant gametes. Multiple crossovers, especially double crossovers (DCOs), are used to determine gene order in three-point mapping.
Single Crossover: Exchange between two nonsister chromatids.
Double Crossover (DCO): Two exchanges, used to determine gene order.
Three-Point Mapping: Allows mapping of three or more linked genes in a single cross.
Interference and Coefficient of Coincidence
Interference describes how one crossover event can inhibit another nearby. The coefficient of coincidence (C) quantifies this effect.
Interference (I):
Positive Interference: Fewer DCOs than expected.
Negative Interference: More DCOs than expected.
Drosophila and Human Chromosome Mapping
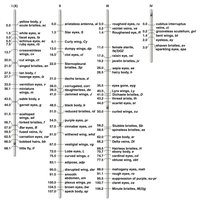
Drosophila chromosome maps were constructed using recombination frequencies. Human chromosome mapping historically relied on lod score analysis and somatic cell hybridization.
Lod Score Analysis: Uses probability calculations to demonstrate linkage in pedigrees.
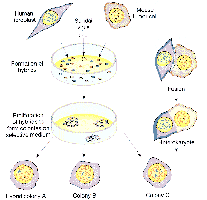
Somatic Cell Hybridization: Fusion of cells from different species to assign genes to chromosomes.
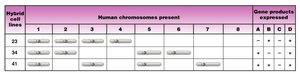
Synteny Testing: Correlates gene products with chromosome presence in hybrid cell lines.
Cytological Evidence and Mitotic Recombination
Mapping in maize using cytological markers established that crossing over involves a physical exchange of chromosome regions. Mitotic recombination, though rare, is important for DNA repair.
Cytological Markers: Used to visualize physical exchanges during crossing over.
Mitotic Recombination: Occurs in somatic cells, important for DNA repair.
Summary of Key Concepts
Genes linked on the same chromosome segregate together.
Crossing over is the basis for determining gene distances in chromosome mapping.
Gene sequence determination requires analysis of multiple crossovers.
Mapping accuracy decreases as gene distance increases.
Drosophila genes have been extensively mapped; human mapping uses lod scores and somatic cell hybridization.
Sample Table: Synteny Testing
Synteny testing allows researchers to assign genes to specific chromosomes by correlating gene product expression with chromosome presence in hybrid cell lines.
Hybrid cell lines | Human chromosomes present | Gene products expressed |
|---|---|---|
23 | 1, 2, 4, 7 | A, C |
34 | 2, 3, 6, 8 | B, D |
41 | 1, 5, 7, 8 | A, D |
Additional info: Table entries inferred for illustration purposes. |
