 Indietro
Mendelian Genetics: Principles, Probability, and Pedigree Analysis
Guida di studio - Note intelligenti
 Appunti personalizzati basati sui tuoi materiali, ampliati con definizioni chiave, esempi e contesto.
Introduction to Mendelian Genetics
Historical Context and Mendel's Experiments
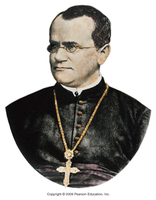
Gregor Mendel, an Austrian monk, is recognized as the father of modern genetics due to his pioneering work with garden peas. His experiments, conducted between 1856 and 1863, established the foundational principles of heredity. Mendel's meticulous approach and use of true-breeding pea plants allowed him to uncover the predictable patterns of inheritance that are now central to genetics.
Mendel’s Model Organism: The Garden Pea (Pisum sativum)
Mendel selected the garden pea for its advantageous characteristics, including ease of cultivation, short generation time, and the presence of distinct, easily observable traits. He focused on seven traits, each with two contrasting forms (phenotypes), and performed controlled crosses to analyze inheritance patterns.
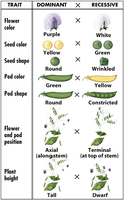
Key Features of Mendel’s Experimental Design
True-breeding strains: Plants that consistently produce offspring with the same phenotype when self-fertilized.
Controlled mating: Mendel used both self-fertilization and cross-fertilization to manipulate genetic crosses.
Quantitative analysis: Mendel recorded large numbers of offspring and applied statistical reasoning to interpret his results.
Monohybrid Crosses and Mendel’s Laws
Monohybrid Crosses
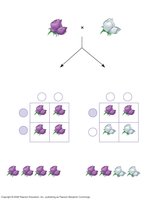
A monohybrid cross involves parents that differ in a single trait. Mendel’s classic experiments with flower color (purple vs. white) revealed that the F1 generation always displayed only one of the parental traits (dominant), while the other (recessive) reappeared in the F2 generation in a 3:1 ratio.
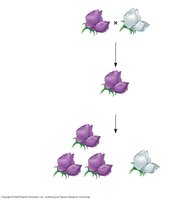
Results of Monohybrid Crosses
F1 generation: All offspring display the dominant phenotype.
F2 generation: Phenotypic ratio of 3 dominant : 1 recessive.
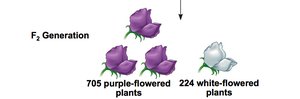
Mendel’s Three Postulates
Unit Factors in Pairs: Genetic traits are controlled by unit factors (now called genes) that exist in pairs in individuals.
Dominance/Recessiveness: When two different unit factors are present, one is dominant and masks the expression of the other, which is recessive.
Segregation: During gamete formation, the paired unit factors separate randomly so that each gamete receives one or the other with equal likelihood.
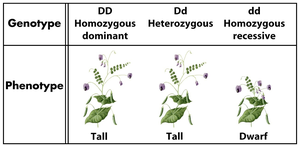
Genotype and Phenotype Ratios
The F2 generation from a monohybrid cross yields a genotypic ratio of 1:2:1 (homozygous dominant : heterozygous : homozygous recessive) and a phenotypic ratio of 3:1 (dominant : recessive).

Test Crosses
A test cross is used to determine whether an individual with a dominant phenotype is homozygous or heterozygous. This is done by crossing the individual with a homozygous recessive partner. The resulting offspring phenotypes reveal the unknown genotype.
Dihybrid and Trihybrid Crosses: Independent Assortment
Mendel’s Fourth Postulate: Independent Assortment
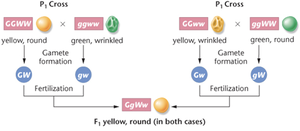
When analyzing two traits simultaneously (dihybrid crosses), Mendel observed that alleles of different genes assort independently during gamete formation. This led to the Law of Independent Assortment, which predicts a 9:3:3:1 phenotypic ratio in the F2 generation for two independently assorting traits.
Trihybrid Crosses and Branched Diagrams
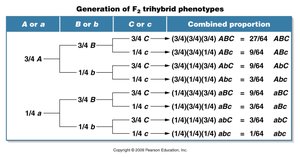
For three or more traits, the forked-line (branched) diagram provides an efficient method to determine phenotype ratios, avoiding the complexity of large Punnett squares.
Probability in Genetics
Basic Probability Rules
Product Law (Multiplication Rule): The probability of two independent events both occurring is the product of their individual probabilities.
Sum Law (Addition Rule): The probability of either of two mutually exclusive events occurring is the sum of their individual probabilities.
The Binomial Theorem
The binomial theorem is used to calculate the probability of a specific combination of outcomes in a series of independent events, such as the distribution of offspring genotypes or phenotypes.
The general formula is:
where n is the total number of events, s is the number of times outcome a occurs, t is the number of times outcome b occurs, a is the probability of outcome a, and b is the probability of outcome b.
Statistical Analysis: Chi-Square Test
Evaluating Genetic Data
The chi-square (χ²) test is used to determine whether observed genetic data fit expected Mendelian ratios. The null hypothesis assumes no significant difference between observed and expected values.
The formula is:
where o is the observed value and e is the expected value for each category.
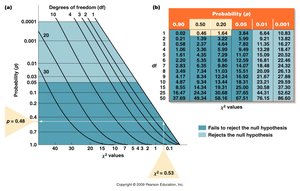
Interpreting p-values
p > 0.05: Fail to reject the null hypothesis; deviations are likely due to chance.
p < 0.05: Reject the null hypothesis; deviations are unlikely due to chance alone.
Pedigree Analysis
Pedigrees and Human Inheritance
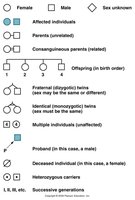
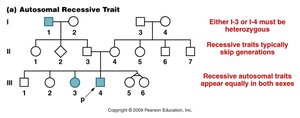
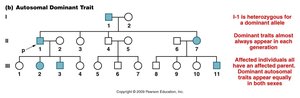
Pedigree charts are used to track inheritance patterns of traits in families. Standardized symbols represent individuals, relationships, and phenotypes. Analysis of pedigrees can reveal whether a trait is dominant, recessive, autosomal, or sex-linked.
Key Patterns in Pedigree Analysis
Autosomal recessive traits: Often skip generations; affected individuals can have unaffected parents; appear equally in both sexes.
Autosomal dominant traits: Usually appear in every generation; affected individuals have at least one affected parent; appear equally in both sexes.
Summary
Mendel’s experiments established the basic laws of inheritance: segregation, dominance, and independent assortment.
Genetic ratios can be predicted using probability rules and analyzed statistically using the chi-square test.
Pedigree analysis is a powerful tool for studying inheritance patterns in humans and other organisms.
