Ch. 20 - Quantitative Genetics and Multifactorial Traits
Klug - Essentials of Genetics 10th Edition
Klug10th EditionEssentials of GeneticsISBN: 9780135588789Non è quello che usi tu?Cambia libro di testo
Capitolo 20, Problema 16

In a herd of dairy cows the narrow-sense heritability for milk protein content is 0.76, and for milk butterfat it is 0.82. The correlation coefficient between milk protein content and butterfat is 0.91. If the farmer selects for cows producing more butterfat in their milk, what will be the most likely effect on milk protein content in the next generation?

Guida verificata passo dopo passo
1
Identify the key parameters given: narrow-sense heritability for milk protein content (\(h^2_{protein} = 0.76\)), narrow-sense heritability for milk butterfat (\(h^2_{butterfat} = 0.82\)), and the phenotypic correlation coefficient between the two traits (\(r_P = 0.91\)).
Understand that selecting for increased butterfat content will cause a correlated response in milk protein content due to the genetic correlation between the traits.
Recall the formula for the correlated response to selection: \(CR_Y = i \times h_Y \times r_A \times \sigma_Y\), where \(CR_Y\) is the correlated response in trait Y (milk protein), \(i\) is the selection intensity on trait X (butterfat), \(h_Y\) is the square root of heritability of trait Y, \(r_A\) is the genetic correlation between traits, and \(\sigma_Y\) is the phenotypic standard deviation of trait Y. Since \(i\) and \(\sigma_Y\) are not given, focus on the relationship between traits.
Calculate the genetic correlation (\(r_A\)) between milk protein and butterfat using the formula: \(r_A = \frac{r_P}{\sqrt{h^2_{protein} \times h^2_{butterfat}}}\). This step helps determine how strongly the traits are genetically linked.
Interpret the sign and magnitude of \(r_A\): a positive and high genetic correlation means that selecting for higher butterfat will likely increase milk protein content in the next generation as well.

Risposta video verificata per un problema simile:

Questa soluzione video è stata consigliata dai nostri tutor come utile per risolvere questo problema.
Durata del video:
4m

Concetti chiave

Ecco i concetti essenziali che devi comprendere per rispondere correttamente alla domanda.

Narrow-Sense Heritability

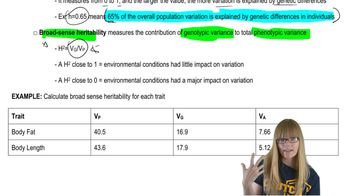
Narrow-sense heritability (h²) measures the proportion of phenotypic variance in a trait that is due to additive genetic factors. It predicts the response to selection because only additive effects are reliably passed from parents to offspring. A high h² indicates that selection will effectively change the trait in the next generation.
Video consigliato:
Percorso guidato
07:04
Calculating Heritability

Genetic Correlation

Genetic correlation quantifies the degree to which two traits share common genetic influences. A positive correlation means that genes increasing one trait tend to increase the other. This implies that selection for one trait can cause a correlated response in the other, even if it is not directly selected.
Video consigliato:
Percorso guidato
03:45
Descriptive Genetics

Correlated Response to Selection

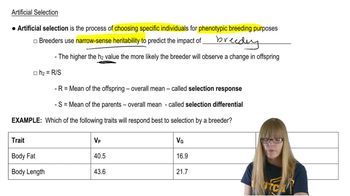
Correlated response occurs when selection on one trait causes a change in another genetically correlated trait. The magnitude depends on heritabilities and the genetic correlation. In this case, selecting for higher butterfat will likely increase milk protein content due to their strong positive genetic correlation.
Video consigliato:
Percorso guidato
04:15
Artificial Selection
Pratica correlata
Domanda del libro di testo

In an assessment of learning in Drosophila, flies were trained to avoid certain olfactory cues. In one population, a mean of 8.5 trials was required. A subgroup of this parental population that was trained most quickly (mean=6.0) was interbred, and their progeny were examined. These flies demonstrated a mean training value of 7.5. Calculate realized heritability for olfactory learning in Drosophila.

438
views
Domanda del libro di testo

The mean and variance of plant height of two highly inbred strains (P₁ and P₂) and their progeny (F₁ and F₂) are shown here.


  Strain  Mean (cm)  Variance 

   P₁     34.2        4.2

   P₂     55.3        3.8

   F₁     44.2        5.6

   F₂     46.3       10.3


Calculate the broad-sense heritability (H²) of plant height in this species.

814
views
Domanda del libro di testo

Suppose you want to develop a population of Drosophila that would rapidly learn to avoid certain substances the flies could detect by smell. Based on the heritability estimate you obtained in Problem 16, do you think it would be worth doing this by artificial selection? Why or why not?

468
views
Domanda del libro di testo

A hypothetical study investigated the vitamin A content and the cholesterol content of eggs from a large population of chickens. The following variances (V) were calculated.

Which trait, if either, is likely to respond to selection?

517
views
Domanda del libro di testo

In a population of tomato plants, mean fruit weight is 60 g and h² is 0.3. Predict the mean weight of the progeny if tomato plants whose fruit averaged 80 g were selected from the original population and interbred.

426
views
Domanda del libro di testo

A hypothetical study investigated the vitamin A content and the cholesterol content of eggs from a large population of chickens. The following variances (V) were calculated.

Calculate the narrow-sense heritability (h²) for both traits.

475
views