Ch. 3 - Mendelian Genetics
Klug - Concepts of Genetics 12th Edition
Klug12th EditionConcepts of GeneticsISBN: 9780135564776Non è quello che usi tu?Cambia libro di testo
Capitolo 3, Problema 19

In assessing data that fell into two phenotypic classes, a geneticist observed values of 250:150. She decided to perform a χ\(\chi\)² analysis by using the following two different null hypotheses:
(a) the data fit a 3:1 ratio, and
(b) the data fit a 1:1 ratio.
Calculate the χ\(\chi\) ² values for each hypothesis. What can be concluded about each hypothesis?

Guida verificata passo dopo passo
1
Step 1: Identify the observed values and total number of observations. Here, the observed counts are 250 and 150, so the total is 250 + 150 = 400.
Step 2: For hypothesis (a), where the expected ratio is 3:1, calculate the expected counts by dividing the total according to this ratio. The expected count for the first class is \(\frac{3}{4} \times 400\), and for the second class is \(\frac{1}{4} \times 400\).
Step 3: For hypothesis (b), where the expected ratio is 1:1, calculate the expected counts by dividing the total equally. Each class is expected to have \(\frac{1}{2} \times 400\) individuals.
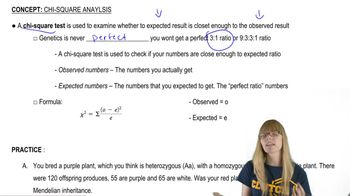
Step 4: Use the chi-square formula to calculate the chi-square value for each hypothesis: \(\chi^{2} = \sum \frac{(O - E)^2}{E}\) where \(O\) is the observed count and \(E\) is the expected count for each phenotypic class. Calculate this sum separately for each hypothesis using their respective expected counts.
Step 5: Compare the calculated chi-square values to the critical chi-square value from the chi-square distribution table at the appropriate degrees of freedom (df = number of classes - 1) and significance level (commonly 0.05). If the calculated value is less than the critical value, the hypothesis fits the data well; if greater, the hypothesis is rejected.

Risposta video verificata per un problema simile:

Questa soluzione video è stata consigliata dai nostri tutor come utile per risolvere questo problema.
Durata del video:
1m

Concetti chiave

Ecco i concetti essenziali che devi comprendere per rispondere correttamente alla domanda.

Chi-Square (χ²) Test

The chi-square test is a statistical method used to compare observed data with expected data based on a specific hypothesis. It calculates a χ² value that measures the difference between observed and expected frequencies. A higher χ² value indicates a greater deviation from the expected ratio, helping to determine if the null hypothesis can be rejected.
Video consigliato:
Percorso guidato
02:48
Chi Square Analysis

Null Hypothesis in Genetic Ratios

In genetics, the null hypothesis often states that observed phenotypic ratios fit a predicted Mendelian ratio, such as 3:1 or 1:1. This hypothesis assumes no significant difference between observed and expected data. Testing different null hypotheses helps identify which genetic model best explains the observed data.
Video consigliato:
Percorso guidato
03:13
Translation:Wobble Hypothesis

Interpreting Chi-Square Results

After calculating the χ² value, it is compared to a critical value from the chi-square distribution table based on degrees of freedom and significance level. If χ² is less than the critical value, the null hypothesis is accepted; if greater, it is rejected. This interpretation determines whether observed deviations are due to chance or indicate a different genetic pattern.
Video consigliato:
Percorso guidato
02:48
Chi Square Analysis
Pratica correlata
Domanda del libro di testo

Thalassemia is an inherited anemic disorder in humans. Affected individuals exhibit either a minor anemia or a major anemia. Assuming that only a single gene pair and two alleles are involved in the inheritance of these conditions, is thalassemia a dominant or recessive disorder?

1066
views
Domanda del libro di testo

The following are F₂ results of two of Mendel's monohybrid crosses.

For each cross, state a null hypothesis to be tested using x² analysis. Calculate the x² value and determine the p value for both. Interpret the p-values. Can the deviation in each case be attributed to chance or not? Which of the two crosses shows a greater amount of deviation?

652
views
Domanda del libro di testo

Mendel crossed peas having round green seeds with peas having wrinkled yellow seeds. All F₁ plants had seeds that were round and yellow. Predict the results of testcrossing these F₁ plants.

695
views
Domanda del libro di testo

The basis for rejecting any null hypothesis is arbitrary. The researcher can set more or less stringent standards by deciding to raise or lower the p value used to reject or not reject the hypothesis. In the case of the chi-square analysis of genetic crosses, would the use of a standard of p = 0.10 be more or less stringent about not rejecting the null hypothesis? Explain.

814
views
Domanda del libro di testo

Draw all possible conclusions concerning the mode of inheritance of the trait portrayed in the following limited pedigree.

1084
views
Domanda del libro di testo

Consider the following pedigree.

Predict the mode of inheritance of the trait of interest and the most probable genotype of each individual. Assume that the alleles A and a control the expression.

4334
views
1
rank