 Indietro
Graphing Linear Functions: Intercepts, Vertical and Horizontal Lines
Guida di studio - Note intelligenti
 Appunti personalizzati basati sui tuoi materiali, ampliati con definizioni chiave, esempi e contesto.
Graphs and Functions
Graphing Linear Functions
Linear functions are fundamental in algebra and are represented by equations of the form y = mx + b, where m is the slope and b is the y-intercept. Graphing these functions helps visualize their behavior and understand their properties.
Definition: A linear function is a function whose graph is a straight line.
General Form:
Slope (m): Indicates the steepness and direction of the line.
Y-intercept (b): The point where the line crosses the y-axis.
Graphing: Plot points by substituting values for x and solving for y.
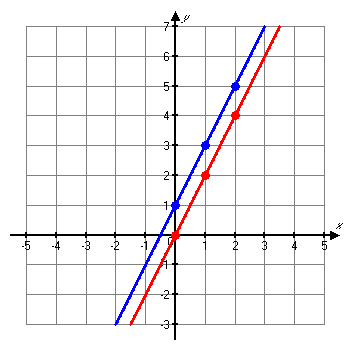
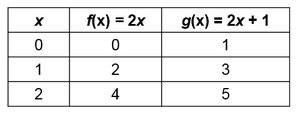
Example: Graph g(x) = 2x + 1 and compare with f(x) = 2x. The graph of g(x) is the same as f(x) shifted upward by 1 unit.
Graphing Linear Functions by Using Intercepts
Intercepts are key points where a graph crosses the axes. They provide a quick way to graph linear equations.
X-intercept: The point where the graph crosses the x-axis (y = 0).
Y-intercept: The point where the graph crosses the y-axis (x = 0).
Finding Intercepts:
To find the x-intercept, set y = 0 and solve for x.
To find the y-intercept, set x = 0 and solve for y.
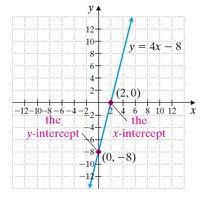
Example: For y = 4x - 8, the y-intercept is (0, -8) and the x-intercept is (2, 0).
Intercepts Table
Equation | X-intercept | Y-intercept |
|---|---|---|
y = 4x - 8 | (2, 0) | (0, -8) |
y = mx + b | Set y = 0, solve for x | (0, b) |
Graphing by Intercepts: Examples
Graphing a line by its intercepts is efficient and accurate. At least two points are needed to draw a line.
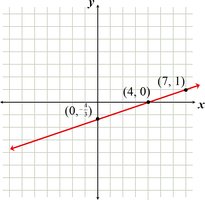
Example: Graph 4 = x - 3y by finding and plotting its intercepts.
Y-intercept: Set x = 0, solve for y.
X-intercept: Set y = 0, solve for x.
Additional Point: Substitute another value for y or x to find a third point.
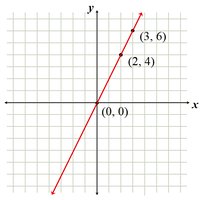
Example: Graph 2x = y by finding and plotting its intercepts.
Both intercepts are at (0, 0), so find additional points such as (3, 6) and (2, 4).
Graphing Vertical and Horizontal Lines
Vertical and horizontal lines are special cases of linear equations. Their graphs are simple and easily recognizable.
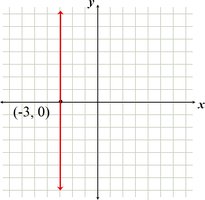
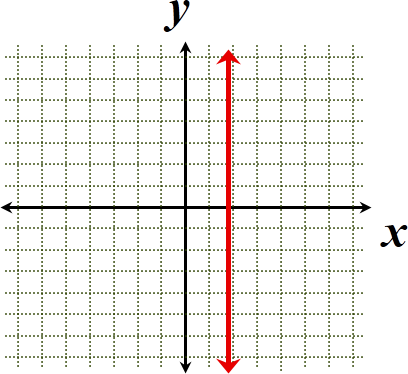
Vertical Line: Equation is x = c, where c is a constant. The graph is a line parallel to the y-axis passing through (c, 0).
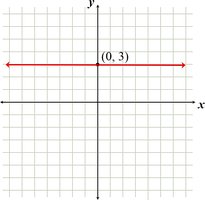
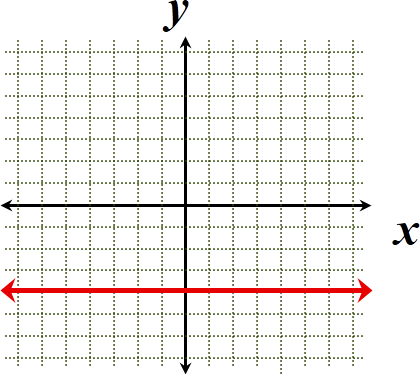
Horizontal Line: Equation is y = c, where c is a constant. The graph is a line parallel to the x-axis passing through (0, c).
Intercepts:
Vertical lines have an x-intercept but no y-intercept.
Horizontal lines have a y-intercept but no x-intercept.
Example: Graph x = -3 (vertical line) and y = 3 (horizontal line).
Vertical and Horizontal Lines Table
Type | Equation | Intercept |
|---|---|---|
Vertical | x = c | (c, 0) |
Horizontal | y = c | (0, c) |
Summary
Linear functions can be graphed using points, slope, and intercepts.
Intercepts provide quick reference points for graphing.
Vertical and horizontal lines are special cases with unique properties.
Understanding these concepts is essential for further study in algebra and functions.
