 Indietro
Graphing Linear Functions: Study Notes for Intermediate Algebra
Guida di studio - Note intelligenti
 Appunti personalizzati basati sui tuoi materiali, ampliati con definizioni chiave, esempi e contesto.
Graphs and Functions
Graphing Linear Functions
Linear functions are fundamental in algebra and are represented by equations of the form y = mx + b, where m is the slope and b is the y-intercept. Graphing these functions helps visualize their behavior and understand their properties.
Definition: A linear function produces a straight line when graphed on a coordinate plane.
General Form:
Slope (m): Indicates the steepness and direction of the line.
Y-intercept (b): The point where the line crosses the y-axis.

Graphing Linear Functions by Using Intercepts
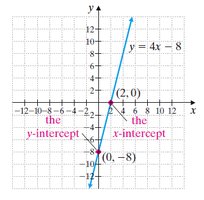
Intercepts are key points used to graph linear functions efficiently. The x-intercept is where the graph crosses the x-axis, and the y-intercept is where it crosses the y-axis. These points can be found by setting the opposite variable to zero and solving.
Finding the x-intercept: Set y = 0 and solve for x.
Finding the y-intercept: Set x = 0 and solve for y.
Graphing: Plot both intercepts and draw a straight line through them.
Example: Graphing g(x) = 2x + 1 and Comparing with f(x) = 2x
To graph g(x) = 2x + 1, calculate several ordered pairs and compare with f(x) = 2x. The graph of g(x) is a vertical shift of f(x) by 1 unit upward.
Ordered pairs: For x = 0, 1, 2:
x | f(x) = 2x | g(x) = 2x + 1 |
|---|---|---|
0 | 0 | 1 |
1 | 2 | 3 |
2 | 4 | 5 |
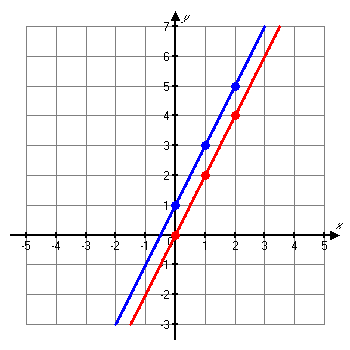
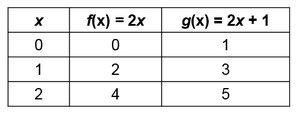
Observation: The y-values for g(x) are obtained by adding 1 to each y-value of f(x). This results in a vertical shift.
Example: Graphing by Intercepts
Consider the equation 4 = x - 3y. To graph, find the intercepts:
Y-intercept: Set x = 0:
X-intercept: Set y = 0:
Additional point: Let y = 1:
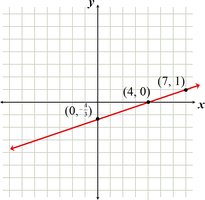
Plot the points (0, -4/3), (4, 0), and (7, 1) and draw the line through them.
Example: Graphing 2x = y
For 2x = y, both intercepts are at (0, 0). Additional points are needed:
Let x = 3: y = 6, so (3, 6)
Let y = 4: x = 2, so (2, 4)
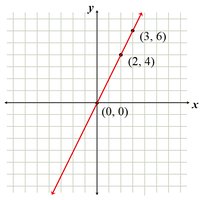
Plot (0, 0), (3, 6), and (2, 4) to graph the line.
Graphing Vertical and Horizontal Lines
Vertical and horizontal lines are special cases of linear equations. Their graphs are straight lines parallel to the axes.
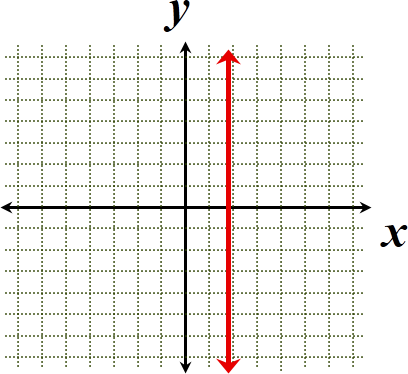
Vertical Line: Equation is x = c. The line is parallel to the y-axis and crosses the x-axis at (c, 0).
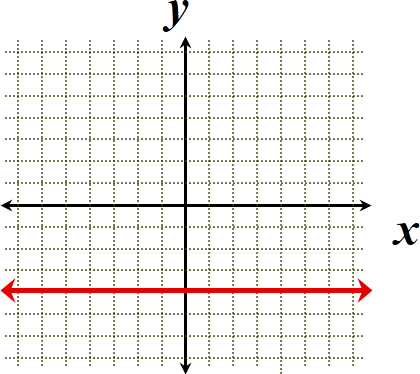
Horizontal Line: Equation is y = c. The line is parallel to the x-axis and crosses the y-axis at (0, c).
Example: Graphing x = -3
The graph is a vertical line passing through x = -3. It has an x-intercept at (-3, 0) and no y-intercept.
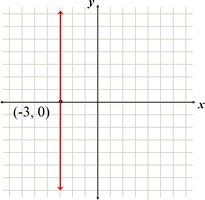
Example: Graphing y = 3
The graph is a horizontal line passing through y = 3. It has a y-intercept at (0, 3) and no x-intercept.
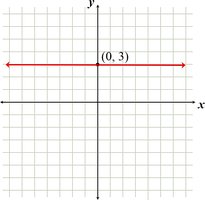
General Properties of Vertical and Horizontal Lines
Vertical lines: The graph of x = c, where c is a real number, is a vertical line with x-intercept (c, 0).
Horizontal lines: The graph of y = c, where c is a real number, is a horizontal line with y-intercept (0, c).
Summary Table: Properties of Linear, Vertical, and Horizontal Lines
Type of Line | Equation | Intercepts | Graph Description |
|---|---|---|---|
Linear (non-vertical/horizontal) | y = mx + b | x-intercept: y-intercept: | Slanted line |
Vertical | x = c | x-intercept: No y-intercept | Line parallel to y-axis |
Horizontal | y = c | y-intercept: No x-intercept | Line parallel to x-axis |
Example: The graph of y = 4x - 8 has x-intercept (2, 0) and y-intercept (0, -8).
Example: The graph of x = -3 is a vertical line through (-3, 0).
Example: The graph of y = 3 is a horizontal line through (0, 3).
