 Indietro
Graphs and Functions – Introduction to Functions (Intermediate Algebra, Ch. 3.2)
Guida di studio - Note intelligenti
 Appunti personalizzati basati sui tuoi materiali, ampliati con definizioni chiave, esempi e contesto.
Graphs and Functions
Introduction to Functions
This section introduces the foundational concepts of relations and functions, focusing on their definitions, properties, and graphical representations. Understanding these concepts is essential for analyzing mathematical relationships and interpreting graphs in algebra.
Section 3.2: Introduction to Functions
Objective 1: Define Relation, Domain, and Range
A relation is any set of ordered pairs. The domain of a relation is the set of all possible input values (x-coordinates), while the range is the set of all possible output values (y-coordinates).
Relation: A set of ordered pairs, such as {(4, 9), (−4, 9), (2, 3), (10, −5)}.
Domain: The set of all first components (x-values) in the relation.
Range: The set of all second components (y-values) in the relation.
Example: For the relation {(4, 9), (−4, 9), (2, 3), (10, −5)}, the domain is {4, −4, 2, 10} and the range is {9, 3, −5}.
Example (Tabular Data): Consider the following relation between animals and their life spans:
Input (Animal) | Output (Life Span) |
|---|---|
Polar Bear | 20 |
Cow | 20 |
Chimpanzee | 15 |
Giraffe | 10 |
Gorilla | 10 |
Kangaroo | 7 |
Red Fox | 7 |
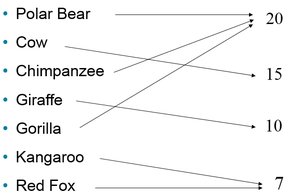
Domain: {Polar Bear, Cow, Chimpanzee, Giraffe, Gorilla, Kangaroo, Red Fox} Range: {20, 15, 10, 7}
Objective 2: Identifying Functions
A function is a special type of relation in which each element of the domain is paired with exactly one element of the range. In other words, no input (x-value) is associated with more than one output (y-value).
It is acceptable for different x-values to share the same y-value.
However, a single x-value cannot correspond to multiple y-values.
Example: The relation {(4, 9), (−4, 9), (2, 3), (10, −5)} is a function because each x-value is paired with only one y-value.
Non-Example: If an x-value is paired with two different y-values, the relation is not a function.
Objective 3: Using the Vertical Line Test
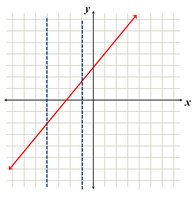
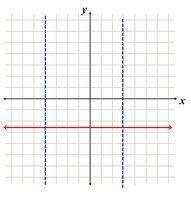
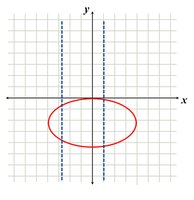
The vertical line test is a graphical method to determine if a graph represents a function. If any vertical line intersects the graph at more than one point, the graph does not represent a function.
If every vertical line crosses the graph at most once, the graph is a function.
If any vertical line crosses the graph more than once, it is not a function.
Example: The following graphs illustrate the vertical line test:
Graph 1: Passes the vertical line test (function).
Graph 2: Passes the vertical line test (function).
Graph 3: Fails the vertical line test (not a function).
Note: All linear equations are functions except those of the form , which are vertical lines.
Objective 4: Finding the Domain and Range of a Function
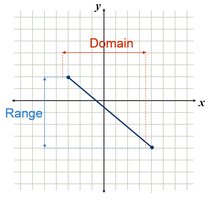
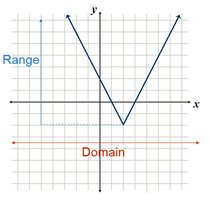
The domain of a function is the set of all possible input values (x-values), and the range is the set of all possible output values (y-values). These can often be determined from the graph of the function using interval notation.
Example: The following graphs show how to identify the domain and range:
Objective 5: Use Function Notation
Function notation is a way to represent functions using symbols. If y is a function of x, we write , which is read as "f of x." Here, x is the independent variable, and y (or f(x)) is the dependent variable.
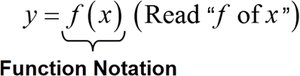
f(x): Denotes the value of the function f at x.
Example: If , then .
Ordered Pair: If , the corresponding ordered pair is (−3, 15).
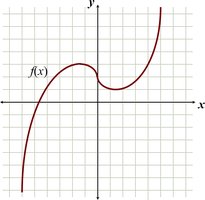
Graphical Example: Function values can also be found by inspecting the graph of a function.
Objective 6: Graph a Linear Function
A linear function is a function that can be written in the form , where m is the slope and b is the y-intercept. The graph of a linear function is a straight line.
Example: For , the y-intercept is −2 and the slope is 3.
To graph a linear function, plot the y-intercept and use the slope to find another point.
Formula:
Additional info: The above notes cover all main objectives from Section 3.2, including definitions, examples, graphical tests, and function notation, with relevant images included only where they directly support the explanation.
