 Indietro
Graphs and the Rectangular Coordinate System: Study Notes for Intermediate Algebra
Guida di studio - Note intelligenti
 Appunti personalizzati basati sui tuoi materiali, ampliati con definizioni chiave, esempi e contesto.
Section 3.1: Reading Graphs and the Rectangular Coordinate System
Rectangular Coordinate System
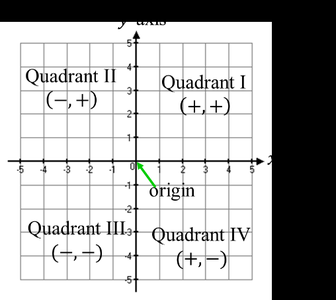
The rectangular coordinate system, also known as the Cartesian plane, is fundamental for graphing equations in two variables. It consists of two perpendicular axes: the x-axis (horizontal) and the y-axis (vertical). The intersection point of these axes is called the origin, denoted as (0, 0). The plane is divided into four quadrants, each with distinct sign conventions for coordinates.
x-axis: Horizontal axis
y-axis: Vertical axis
Origin: Intersection of axes, (0, 0)
Quadrants: Four regions defined by the axes
Plotting Ordered Pairs
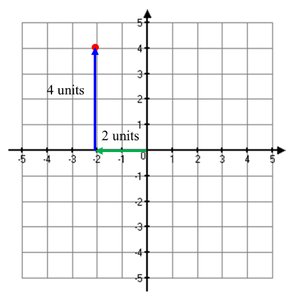
Each point in the plane corresponds to a unique ordered pair (a, b), where a is the x-coordinate and b is the y-coordinate. To plot a point (x, y), start at the origin, move x units left or right (right if x is positive, left if x is negative), then move y units up or down (up if y is positive, down if y is negative). The order of coordinates is crucial, as (–4, 2) and (2, –4) are in different locations.
First coordinate (x): Horizontal movement
Second coordinate (y): Vertical movement
Example: Plot (-2, 4): Move 2 units left, 4 units up
Identifying Quadrants and Axes
When plotting points, it is important to identify the quadrant or axis where the point lies:
Quadrant I: (+, +)
Quadrant II: (–, +)
Quadrant III: (–, –)
Quadrant IV: (+, –)
On axes: If either coordinate is zero, the point lies on an axis
Graphs of Equations
A relationship between two quantities can be expressed as an equation in two variables. The solution set of an equation consists of all ordered pairs (x, y) that satisfy the equation. The graph of the equation is the set of these solutions plotted in the coordinate plane.
Equation in two variables: Example: y = 2x + 1
Solution set: All (x, y) pairs that make the equation true
Graph: Visual representation of the solution set
Determining Solutions to Equations
To check if an ordered pair is a solution to an equation, substitute the values into the equation and verify if the statement is true.
Example: Is (3, –2) a solution to ? Substitute x = 3, y = –2:
(True, so (3, –2) is a solution)
Example: Is (–1, 6) a solution to ? Substitute x = –1, y = 6:
(False, so (–1, 6) is not a solution)
Linear Equations in Two Variables
A linear equation in two variables can be written in standard form:
Standard form:
A, B, C: Real numbers; A and B are not both zero
Example:
Graphing Linear Equations
To graph a linear equation, find several ordered pair solutions and plot them. If the equation is solved for y, choose x-values; if solved for x, choose y-values. Connect the points to form a straight line.
Example: Graph by choosing x = 1:
x | y |
|---|---|
1 | 2 |
Example: Graph by choosing x = 0:
x | y |
|---|---|
0 | 3 |
4 | 6 |
-4 | 0 |
Additional info: More points can be chosen for accuracy. |
Intercepts
Intercepts are key features of graphs:
x-intercept: The x-coordinate where the graph crosses the x-axis (y = 0)
y-intercept: The y-coordinate where the graph crosses the y-axis (x = 0)
Graphing Nonlinear Equations
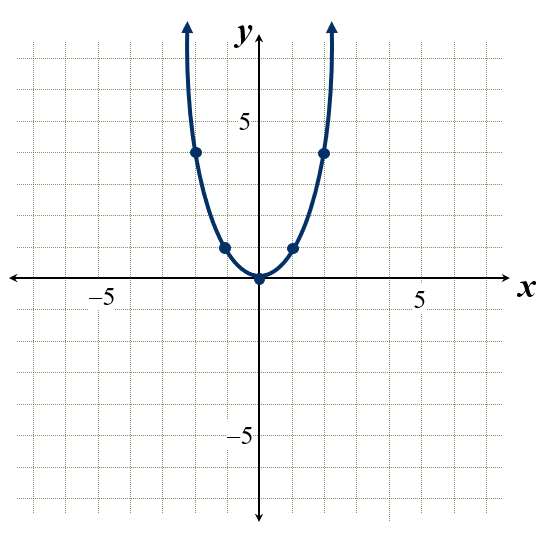
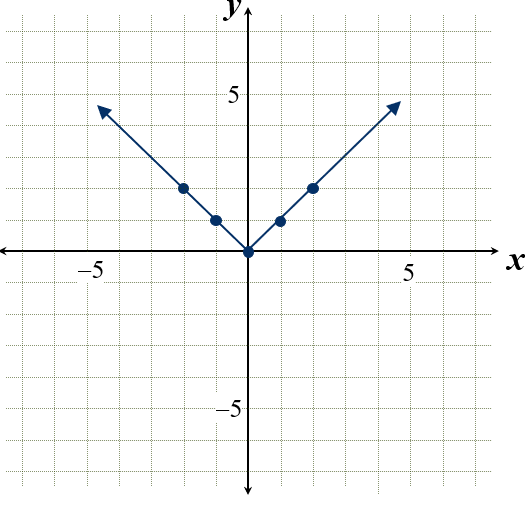
Nonlinear equations produce graphs that are not straight lines. Common examples include parabolas and absolute value graphs. The best approach is to plot points near the origin to understand the graph's shape.
Example: Graph (parabola)
Example: Graph (V-shaped graph)
Example: Graph (curve starting at the origin)
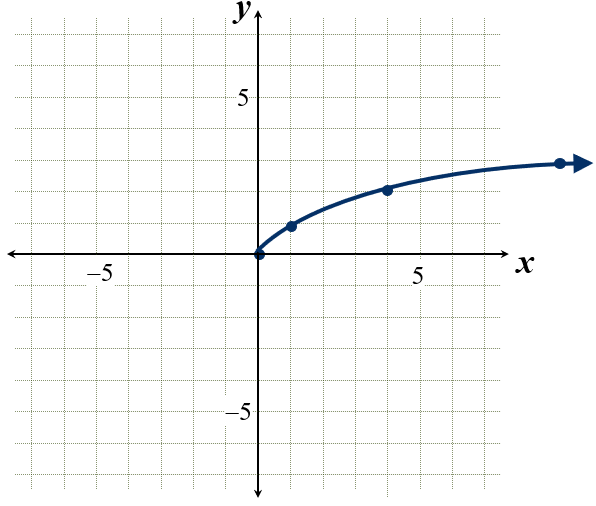
Summary Table: Common Graph Types
Equation | Graph Type | Key Features |
|---|---|---|
Parabola | Vertex at (0,0), opens upward | |
Absolute Value | Vertex at (0,0), V-shape | |
Square Root | Starts at (0,0), increases slowly |
Additional info: Understanding the basic shapes of graphs helps in identifying and sketching equations quickly.
