 Indietro
Intermediate Algebra Review: Domain, Range, Functions, Slope, Equations, and Systems
Guida di studio - Note intelligenti
 Appunti personalizzati basati sui tuoi materiali, ampliati con definizioni chiave, esempi e contesto.
Q31. Graph the inequality:
Background
Topic: Linear Inequalities and Graphing
This question tests your ability to graph a linear inequality in two variables. You need to determine which region of the coordinate plane satisfies the inequality.
Key Terms and Formulas:
Linear inequality: An inequality involving a linear function, such as .
Boundary line: The line is the boundary for the inequality.
Shading: The region where the inequality holds true is shaded.
Step-by-Step Guidance
Rewrite the inequality as an equation to find the boundary line: .
Find the x- and y-intercepts of the boundary line by setting and respectively.
Plot the boundary line on the coordinate plane. Decide whether the line should be solid (for or ) or dashed (for or ).
Choose a test point (such as ) and substitute it into the original inequality to determine which side of the line to shade.
Shade the region that satisfies . The shaded area represents all solutions to the inequality.
Check your graph to ensure the correct region is shaded and the boundary line is properly drawn.
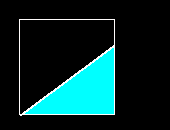
Try solving on your own before revealing the answer!
Final Answer:
The correct graph is the one where the region above and to the right of the boundary line is shaded, including the boundary line itself. This matches image_3.
We use a solid line because the inequality is . The shaded region represents all pairs that satisfy .
Q36. Graph the solution of the system of linear inequalities: and
Background
Topic: Systems of Linear Inequalities
This question tests your ability to graph two linear inequalities and find the region where both are satisfied simultaneously.
Key Terms and Formulas:
System of inequalities: Two or more inequalities graphed together.
Intersection: The solution is the region where the shaded areas of both inequalities overlap.
Boundary lines: and .
Step-by-Step Guidance
Graph the boundary lines and on the coordinate plane. Use solid lines since both inequalities include equality (, ).
For , shade the region above the line .
For , shade the region below the line .
The solution to the system is the region where the two shaded areas overlap.
Check your graph to ensure the intersection is correctly identified and both boundary lines are solid.
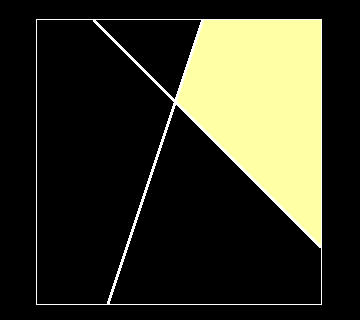
Try solving on your own before revealing the answer!
Final Answer:
The correct graph is image_4, where the region between the two lines and is shaded, representing the intersection of the two inequalities.
This region includes all points that satisfy both and .
