 Indietro
Relations and Functions: Definitions, Domain, Range, and the Vertical Line Test
Guida di studio - Note intelligenti
 Appunti personalizzati basati sui tuoi materiali, ampliati con definizioni chiave, esempi e contesto.
Linear Equations, Graphs, and Functions
Introduction to Relations and Functions
This section introduces the foundational concepts of relations and functions, which are essential for understanding how variables interact in algebra. Students will learn to define, identify, and analyze relations and functions using ordered pairs, tables, graphs, and equations.
Relations
A relation is any set of ordered pairs. Relations can be represented in multiple ways, including as sets of ordered pairs, tables, graphs, mappings, or rules (equations).
Ordered Pair: A pair of elements written as (x, y), where x is the input (independent variable) and y is the output (dependent variable).
Table: A tabular arrangement showing corresponding x and y values.
Graph: A visual representation of ordered pairs on the coordinate plane.
Mapping: A diagram showing how each element of the domain is paired with an element in the range.
Rule: An equation that describes the relationship between x and y.
Example: The set { (1, 2), (2, 3), (3, 4) } is a relation.
Functions
A function is a special type of relation in which each value of the independent variable (x) is paired with exactly one value of the dependent variable (y). In other words, no two ordered pairs have the same first component with different second components.
Definition: A function is a relation in which, for each distinct value of the first component, there is exactly one value of the second component.
Notation: If y is a function of x, we write y = f(x).
Example: The set { (1, 2), (2, 3), (3, 4) } is a function, but { (1, 2), (1, 3), (2, 4) } is not, because the input 1 is paired with two different outputs (2 and 3).
Domain and Range
For every relation or function, two important sets are defined:
Domain: The set of all possible values of the independent variable (x).
Range: The set of all possible values of the dependent variable (y).
Example: For the relation { (1, 2), (2, 3), (3, 4) }, the domain is {1, 2, 3} and the range is {2, 3, 4}.
Identifying Functions from Graphs and Equations
Functions can be identified visually using their graphs or analytically using their equations. The vertical line test is a key tool for determining whether a graph represents a function.
Vertical Line Test: If every vertical line intersects the graph of a relation at most once, the relation is a function.
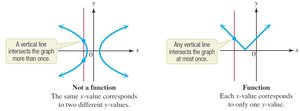
Example: The graph of y = x2 passes the vertical line test and is a function, while the graph of x = y2 does not and is not a function.
Classroom Example: Finding Domains and Ranges from Graphs
To find the domain and range from a graph, observe the extent of the graph along the x-axis (domain) and y-axis (range).
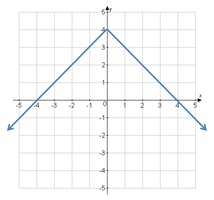
Example: For the graph above, the domain is all real numbers from -5 to 5, and the range is all real numbers from -5 to 5.
Determining Domain from Equations
When a relation is defined by an equation, the domain consists of all real numbers for which the equation produces real values. Exclude values that:
Make the denominator of a fraction zero.
Result in an even root (such as a square root) of a negative number.
Example: For , the domain is all real numbers except .
Example: For , the domain is all real numbers .
Variations of the Definition of a Function
A function is a set of distinct ordered pairs in which no first component is repeated.
A function is a correspondence (mapping) or an equation (rule) that assigns exactly one range value to each distinct domain value.
Summary Table: Ways to Define a Relation
Method | Description |
|---|---|
Ordered Pairs | List of (x, y) pairs |
Table | Tabular arrangement of x and y values |
Graph | Plot of points on the coordinate plane |
Mapping | Diagram showing correspondence between domain and range |
Rule/Equation | Algebraic expression relating x and y |
Additional info: The vertical line test is a visual method for determining if a graph represents a function. If any vertical line crosses the graph more than once, the relation is not a function. The domain and range are fundamental for describing the set of inputs and outputs for a relation or function.
