 Indietro
Systems of Linear Inequalities: Graphing and Solution Sets
Guida di studio - Note intelligenti
 Appunti personalizzati basati sui tuoi materiali, ampliati con definizioni chiave, esempi e contesto.
Systems of Equations
Systems of Linear Inequalities
In Intermediate Algebra, a system of linear inequalities consists of two or more linear inequalities considered simultaneously. The solution to such a system is the set of all ordered pairs (points) that satisfy every inequality in the system.
Linear Inequality: An inequality involving a linear expression, such as .
System of Linear Inequalities: Two or more linear inequalities grouped together, e.g., and .
Solution: Any ordered pair that makes all inequalities in the system true.
Graphing Systems of Linear Inequalities
To solve a system of linear inequalities graphically, follow these steps:
Step 1: Graph each inequality on the same set of axes. Use a dashed line for inequalities with < or > (not including equality), and a solid line for ≤ or ≥ (including equality).
Step 2: Shade the region that represents the solution to each inequality. The solution to the system is the region where the shaded areas overlap.
Step 3: The final solution set is the intersection of all shaded regions.
Example 1: Boundary Line and Solution Region
Consider the system with boundary line . The solution region is the set of points that satisfy both inequalities in the system. If the shaded regions do not overlap, the system has no solution.
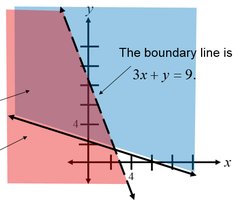
Key Point: The boundary line separates the solution region from the non-solution region. If there is no overlap, the system has no solution.
Example 2: No Solution Case
Sometimes, the shaded regions for two inequalities do not overlap, indicating that there is no solution to the system.
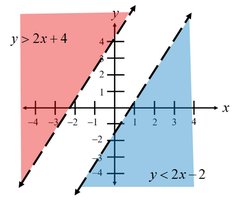
Key Point: If the solution regions for each inequality do not intersect, the system has no solution.
Example 3: Overlapping Solution Region
When graphing two inequalities, the solution to the system is the region where the shaded areas overlap. Dashed lines indicate that the boundary is not included in the solution.
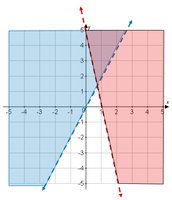
Key Point: The solution set is the region common to both inequalities, often shown by a distinct shading (e.g., purple).
Example 4: Graphing Multiple Inequalities
Graph both inequalities on the same axes. The solution set is the intersection of the shaded regions.
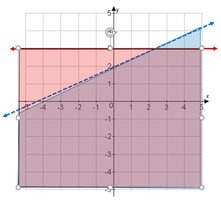
Key Point: The solution set may be a bounded or unbounded region, depending on the inequalities.
Example 5: Solution Set for a System
Graph the solution of the system by plotting each inequality and identifying the region where all conditions are satisfied.
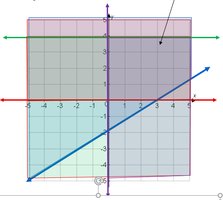
Key Point: The solution set is the region where all shaded areas overlap, representing all points that satisfy every inequality in the system.
Summary Table: Graphing Systems of Linear Inequalities
Step | Description |
|---|---|
1 | Graph each inequality on the same axes (dashed or solid lines as appropriate). |
2 | Shade the region representing the solution to each inequality. |
3 | The solution to the system is the intersection of all shaded regions. |
Key Terms and Concepts
Boundary Line: The line corresponding to the equality part of the inequality (e.g., ).
Dashed Line: Used for < or > inequalities; the boundary is not included.
Solid Line: Used for ≤ or ≥ inequalities; the boundary is included.
Solution Region: The area where all inequalities are satisfied.
Example of a System of Linear Inequalities
Consider the system:
Graph each inequality, shade the appropriate region, and identify the intersection. In this case, there is no overlap, so the system has no solution.
Additional info: The examples and images reinforce the graphical approach to solving systems of linear inequalities, which is a key skill in Intermediate Algebra. Understanding how to interpret and construct these graphs is essential for solving real-world problems involving constraints.
