 Indietro
Aggregate Incomes and Productivity: International Comparisons and Determinants
Guida di studio - Note intelligenti
 Appunti personalizzati basati sui tuoi materiali, ampliati con definizioni chiave, esempi e contesto.
Aggregate Incomes Around the World
Introduction to Aggregate Incomes
Aggregate incomes refer to the total income earned by all individuals in a country, often measured as GDP per capita. Understanding how incomes vary across countries is essential for analyzing global economic disparities and development.
GDP per capita: The total value of goods and services produced in a country divided by its population.
PPP-adjusted GDP per capita: GDP per capita adjusted for differences in price levels between countries, allowing for more accurate comparisons.
In 2025, the IMF ranked China 83rd out of 203 countries in PPP-adjusted GDP per capita, with the poorest country, Burundi, at $994.
Comparing Aggregate Incomes Across Countries
Methods for Cross-Country Comparison
Comparing incomes across countries requires converting GDP per capita into a common currency. Two main methods are used:
Exchange-rate approach: Converts GDP using current market exchange rates. This method is affected by fluctuations and differences in prices, especially for non-tradable goods.
Purchasing Power Parity (PPP) approach: Adjusts GDP based on the relative prices of a representative bundle of goods and services in each country. This method provides a more accurate reflection of living standards.
Problems with Exchange Rates
Exchange rates fluctuate for reasons unrelated to price changes.
Prices of non-tradable goods (e.g., housing) vary significantly across countries.
PPP Adjustment
PPP adjustment is estimated by organizations like the IMF and World Bank.
For example, US GDP per capita was $90,000 in 2025 (PPP-adjusted).
Income Distribution and Development Indicators
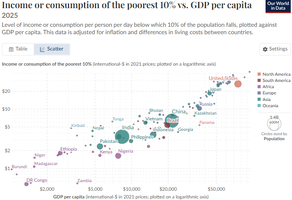
GDP per Capita vs. Daily Income of the Poorest 10%
Economic development is not only measured by average income but also by the income of the poorest segments of society.
There is a strong correlation between GDP per capita and the daily income of the poorest 10%.
Countries with higher GDP per capita tend to have higher incomes for their poorest citizens.
GDP per Capita vs. Human Development Index (HDI) and Life Expectancy
Higher GDP per capita is generally associated with higher HDI and longer life expectancy.
HDI incorporates income, education, and health outcomes.
Productivity and Its Determinants
Productivity: Definition and Importance
Productivity measures the value of goods and services produced by workers in a given period. It is a key determinant of aggregate income and economic growth.
Human Capital: Skills, education, and knowledge possessed by workers.
Physical Capital: Business structures, equipment, and other physical resources used for production.
Technology: Knowledge and efficiency in production processes.
The Aggregate Production Function
Structure of the Aggregate Production Function
The aggregate production function describes how inputs (capital, labor, technology) are transformed into output.
Physical and human capital must be accumulated through investment.
Technology enhances both the quality and efficiency of capital and labor.
General Form of the Production Function
The production function can be represented as: where: = total output = technology factor = physical capital = human capital
Diminishing Marginal Product of Capital
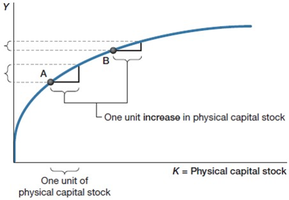
The production function exhibits diminishing returns to capital, meaning each additional unit of capital increases output by less than the previous unit.
As capital stock increases, the marginal gain in output decreases.
This principle is illustrated in the diagram below:
The Role of Technology in Production
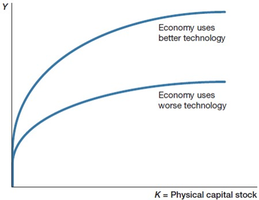
Technology determines the efficiency and knowledge available for production.
Better technology allows economies to produce more output with the same amount of capital.
Technological progress is driven by entrepreneurs, firms, and sometimes government initiatives.
Human and Physical Capital
Human Capital
Human capital includes the knowledge and skills that enable workers to produce new or improved goods and perform tasks more efficiently.
Education and training are key sources of human capital.
Human capital is essential for innovation and productivity growth.
Physical Capital
Physical capital consists of tangible assets used in production, such as machinery, buildings, and infrastructure.
Investment in physical capital increases productivity.
Technological improvements enhance the effectiveness of physical capital.
Determinants of Technology
Sources of Technological Advancement
Advances in technology result from the optimizing decisions of entrepreneurs and firms, as well as government research and development.
Firms seek to develop new products and improve production efficiency.
Government initiatives can lead to technological spin-offs that benefit the broader economy.
Summary Table: Differences in Aggregate Income, Education, Physical Capital & Technology
Country | Aggregate Income | Education | Physical Capital | Technology |
|---|---|---|---|---|
High-income (e.g., US) | High | High | High | Advanced |
Middle-income (e.g., China) | Medium | Medium | Medium | Improving |
Low-income (e.g., Burundi) | Low | Low | Low | Limited |
Additional info: Table entries inferred from global economic patterns and the provided notes.
