 Indietro
Economic Growth, the Financial System, and Business Cycles: Study Notes
Guida di studio - Note intelligenti
 Appunti personalizzati basati sui tuoi materiali, ampliati con definizioni chiave, esempi e contesto.
Economic Growth
Definition and Measurement
Economic growth refers to the sustained increase in a country's production of goods and services, typically measured by the rise in real Gross Domestic Product (GDP) per capita. This metric is considered the best, though not perfect, indicator of the standard of living in a nation.
Real GDP per capita: The value of all goods and services produced in a country, adjusted for inflation, divided by the population.
Standard of living: Reflects the average wealth, comfort, material goods, and necessities available to a population.
Historical context: In 1900, U.S. homes had limited access to electricity, running water, and indoor flush toilets. By 2022, real GDP per capita increased more than 9-fold, indicating substantial improvements in living standards.
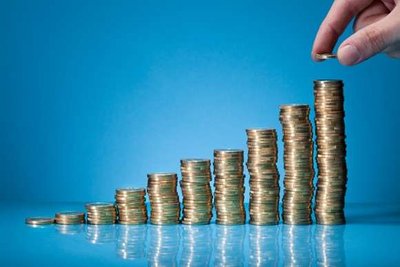
Rule of 70: Used to estimate the number of years required for a variable (such as GDP) to double, given a constant annual growth rate.
Formula:
Example: If the annual growth rate of real GDP per capita is 2%, it will take approximately 35 years for the standard of living to double.
Long-Run Economic Growth
Sources of Growth
Long-run economic growth is driven by increases in labor productivity, which is the amount of goods and services produced by one worker or one hour of work. Productivity improvements depend on two main factors:
Quantity of capital per worker: Capital includes machinery, equipment, and infrastructure that workers use to produce goods and services.
Technological advances: Innovations and improvements in technology are the most important contributors to productivity growth.
Labor productivity:
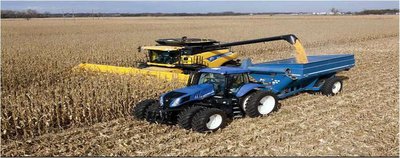
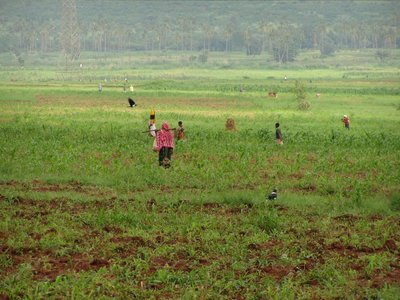
Example: The transition from manual farming to mechanized agriculture significantly increases output per worker, raising overall productivity and economic growth.
Potential GDP
Definition and Dynamics
Potential GDP is the level of real GDP achieved when all firms are operating at full capacity, using normal hours and a normal workforce. It is not the maximum possible output, but rather the sustainable output level under typical conditions.
Growth of potential GDP: Increases as the labor force expands, new factories and office buildings are constructed, new machinery and equipment are installed, and technological change occurs.
Example: As a country invests in education, infrastructure, and technology, its potential GDP rises, allowing for higher sustainable output.
The Financial System
Structure and Importance
The financial system consists of financial markets and financial intermediaries. It plays a crucial role in economic growth by channeling funds from savers to borrowers and providing returns to savers.
Financial markets: Platforms where securities, such as stocks and bonds, are bought and sold.
Financial intermediaries: Institutions like banks, credit unions, and insurance companies that facilitate the flow of funds.
Functions: Provides funds for capital investment, training workers, and developing new technologies.
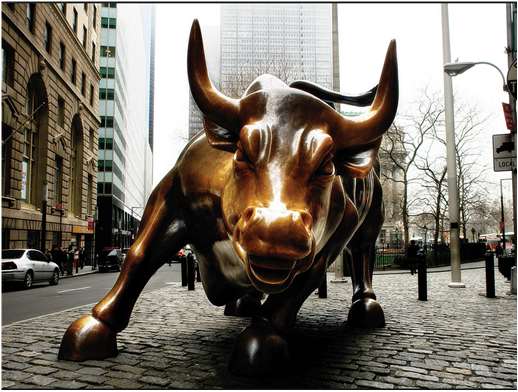
Example: As a student, the financial system enables access to student loans; as a homeowner, it provides mortgages; as a business owner, it offers investment capital.
Business Cycles
Phases and Turning Points
The business cycle refers to the alternating periods of economic expansion and recession around the long-run growth trend. It consists of two main phases and two turning points:
Expansion: Period when economic activity increases, real GDP rises, and unemployment falls.
Peak: The highest point of economic activity before a downturn.
Recession: Significant decline in economic activity, lasting more than a few months, visible in industrial production, employment, real income, and wholesale-retail trade.
Trough: The lowest point of economic activity before recovery begins.
Sequence: Expansion → Peak → Recession → Trough
Rule of thumb: A recession is often defined as two consecutive quarters of negative growth in real GDP.
Inflation and Unemployment in the Business Cycle
Behavior During Cycles
Inflation and unemployment rates fluctuate with the business cycle:
Inflation: Usually increases during expansion and decreases during recession.
Unemployment: Falls during expansion and rises during recession, except at the beginning of an expansion when discouraged workers reenter the labor force and firms are slow to hire.
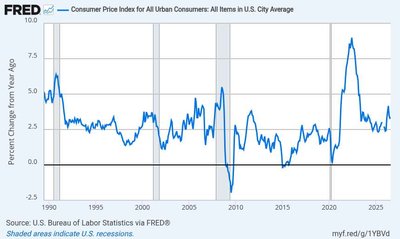
Example: After a recession, unemployment may temporarily rise as more people seek jobs, even though economic activity is picking up.
Summary Table: Business Cycle Phases and Effects
Phase | Economic Activity | Inflation | Unemployment |
|---|---|---|---|
Expansion | Increasing | Rising | Falling |
Peak | Highest | High | Low |
Recession | Decreasing | Falling | Rising |
Trough | Lowest | Low | High |
Additional info: The notes expand on brief points from the slides, providing definitions, examples, and context for each concept. Images are included only where they directly reinforce the explanation of economic growth, productivity, financial systems, and business cycles.
