 Indietro
Macroeconomics: Core Concepts and Models (Chapters 1–4)
Guida di studio - Note intelligenti
 Appunti personalizzati basati sui tuoi materiali, ampliati con definizioni chiave, esempi e contesto.
Introduction to Macroeconomics
What Is Economics?
Economics is the study of how societies allocate scarce resources to satisfy unlimited wants. The central ideas are scarcity and choice. Because resources are limited, every choice involves a tradeoff, and people respond to incentives. Economics is a social science that uses measurement and quantification to analyze decisions and outcomes.
Scarcity: The fundamental economic problem of having limited resources to meet unlimited wants.
Choices and Incentives: Decisions are made by weighing costs and benefits, and incentives influence these choices.
Scope: Economics covers not only markets and finance but also social issues like education, health, and inequality.
Microeconomics vs. Macroeconomics
Economics is divided into two main branches:
Microeconomics: Studies individual and business choices, market interactions, and government influence on specific markets.
Macroeconomics: Examines the performance of national and global economies, including growth, unemployment, and inflation.
Two Big Economic Questions
What is produced? How? For whom? Involves understanding production, expenditure, and income distribution.
When do markets work well? When do they fail? Explores efficiency, equity, and the role of government in correcting market failures.
Production and Factors of Production
Goods and services are produced to satisfy human wants. Production uses four main factors:
Capital: Tools, machines, and buildings.
Labor: Human effort, enhanced by education and health (human capital).
Land: Natural resources.
Entrepreneurship: Organizing production and taking risks.
Human Capital and Education
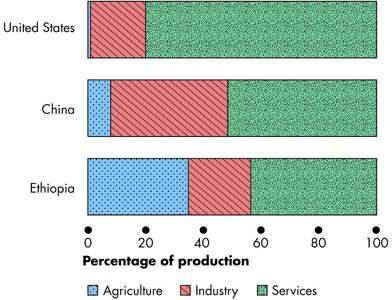
Human capital increases productivity through education, training, and health. Higher educational attainment leads to a more skilled workforce.
Income Distribution
Income is earned by supplying factors of production:
Land earns rent.
Labor earns wages.
Capital earns interest.
Entrepreneurship earns profit.
Wealth and income inequality arise from differences in ownership and human capital.
Efficiency and Equity
Pareto efficiency is achieved when no one can be made better off without making someone else worse off. However, efficiency does not guarantee fairness in income distribution.
Measuring Inequality: Lorenz Curve and Gini Index
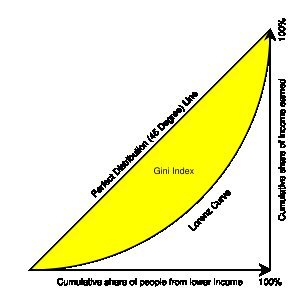
The Lorenz curve shows income distribution, and the Gini index quantifies inequality (0 = perfect equality, 1 = maximum inequality).
The Economic Way of Thinking
Choices are tradeoffs.
Rational choices compare marginal benefit and marginal cost.
People respond to incentives.
The Economic Problem
The Production Possibilities Frontier (PPF)
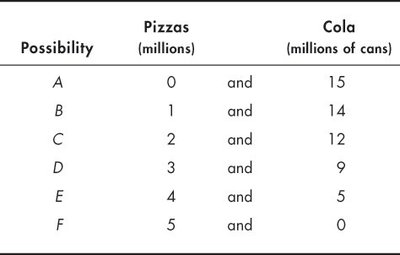
The PPF shows the maximum combinations of two goods that can be produced with available resources and technology. Points on the PPF are efficient, inside are inefficient, and outside are unattainable.
Possibility | Pizzas (millions) | Cola (millions of cans) |
|---|---|---|
A | 0 | 15 |
B | 1 | 14 |
C | 2 | 12 |
D | 3 | 9 |
E | 4 | 5 |
F | 5 | 0 |
Opportunity Cost
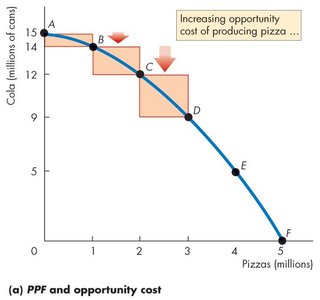
The opportunity cost of producing one good is the amount of the other good forgone. On the PPF, this is shown by the slope. As more of one good is produced, the opportunity cost increases (law of increasing opportunity cost).
Marginal Cost and Marginal Benefit
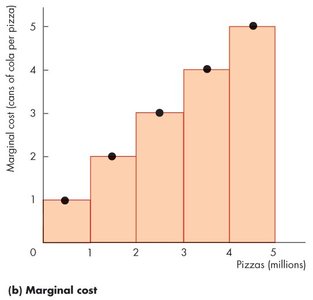
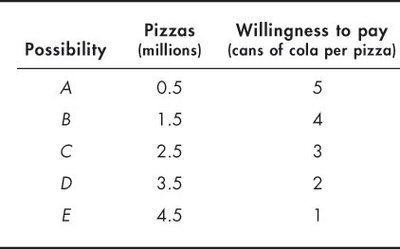
Marginal cost is the opportunity cost of producing one more unit. Marginal benefit is the additional benefit from consuming one more unit, which typically decreases as quantity increases (diminishing marginal utility).
Efficient Resource Allocation
The most efficient production point is where marginal benefit equals marginal cost, and production is on the PPF.
Comparative Advantage and Gains from Trade
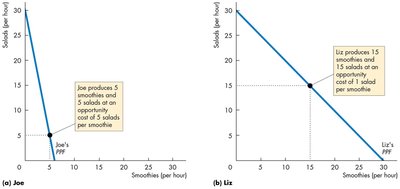
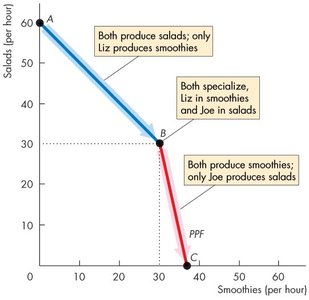
Countries (or individuals) have a comparative advantage if they can produce a good at a lower opportunity cost than others. Specialization and trade allow all parties to consume beyond their individual PPFs, leading to Pareto improvements.
Person | Opportunity cost of 1 salad | Opportunity cost of 1 smoothie |
|---|---|---|
Joe | 1/5 smoothies | 5 salads |
Liz | 1 smoothie | 1 salad |
Supply and Demand
Demand
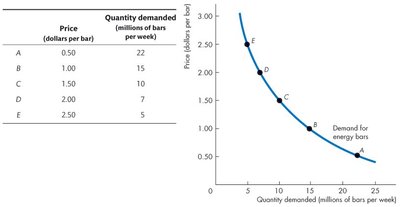
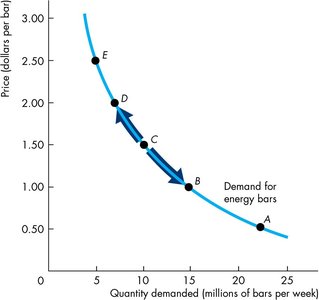
Demand is the relationship between the price of a good and the quantity consumers are willing and able to buy. The law of demand states that, other things equal, higher prices lead to lower quantity demanded (downward-sloping demand curve).
Substitution effect: Higher prices lead consumers to substitute away from the good.
Income effect: Higher prices reduce purchasing power.
Shifts in Demand
Factors other than price can shift the demand curve:
Prices of related goods (substitutes and complements)
Expected future prices
Income (normal vs. inferior goods)
Population
Preferences
Supply
Supply is the relationship between the price of a good and the quantity producers are willing and able to sell. The law of supply states that, other things equal, higher prices lead to higher quantity supplied (upward-sloping supply curve).
Producers supply goods only if price covers marginal cost.
Marginal cost typically increases as output rises.
Shifts in Supply
Factors that shift the supply curve include:
Prices of factors of production
Prices of related goods in production
Expected future prices
Number of suppliers
Technological advances
State of nature (e.g., disasters)
Market Equilibrium
Equilibrium occurs where quantity demanded equals quantity supplied. The equilibrium price balances buyers' and sellers' plans. If price is below equilibrium, there is a shortage; if above, a surplus.
Price adjusts to eliminate shortages or surpluses.
Changes in demand or supply shift the equilibrium price and quantity.
Measuring National Output and Income (GDP)
Gross Domestic Product (GDP)
GDP is the total market value of all newly produced final goods and services in a country in a year. It can be measured by production, expenditure, or income approaches, and is compiled by agencies like the BEA.
GDP per capita is used to compare average income across countries.
GDP = C + I + G + (X − M), where C = consumption, I = investment, G = government purchases, X = exports, M = imports.
Production Approach
Only newly produced, final goods and services are counted.
Intermediate goods are excluded to avoid double counting; only value added at each stage is included.
GDP measures production within a country's borders; GNP adds net factor payments from abroad.
Expenditure Approach
Consumption (C): Durable goods, nondurables, services.
Investment (I): Business and residential investment, includes inventory changes.
Government Purchases (G): Excludes transfers like social security.
Net Exports (NX): Exports minus imports.
Income Approach
Sum of wages, profits, rents, interest, taxes, and depreciation.
Labor share is about 2/3 of GDP; capital share is about 1/3.
Nominal vs. Real GDP
Nominal GDP is measured in current prices; real GDP is adjusted for inflation using a price index (e.g., CPI). The inflation rate is calculated as:
Purchasing Power Parity (PPP)
PPP adjusts GDP comparisons across countries for differences in price levels, using the cost of a common basket of goods.
Shortcomings of GDP
Does not account for pollution, resource depletion, or value of leisure.
Misses home production and underground economy.
GDP per capita may not reflect typical living standards if income distribution is highly unequal; median income may be a better measure.
