 Indietro
Measuring Inflation and Real vs. Nominal Changes in Macroeconomics
Guida di studio - Note intelligenti
 Appunti personalizzati basati sui tuoi materiali, ampliati con definizioni chiave, esempi e contesto.
Measuring Inflation
Introduction to Inflation
Inflation is a central concept in macroeconomics, referring to the general increase in prices across an economy over time. Understanding how inflation is measured and its implications is crucial for analyzing economic performance and policy.
Inflation is typically measured as the percentage change in a price index over a specific period.
Different indices capture different aspects of price changes, such as consumer prices, producer prices, or the overall price level in the economy.
Demand, Supply, and Equilibrium
Substitutes and Complements
Substitute goods are products that can replace each other; an increase in the price of one leads to an increase in demand for the other (e.g., plums and apples).
Complementary goods are products used together; an increase in the price of one leads to a decrease in demand for the other.
Supply Shocks and Market Equilibrium
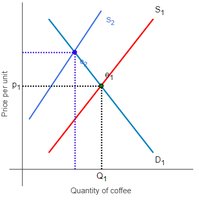
A supply shock, such as a drought affecting coffee production, shifts the supply curve, impacting equilibrium price and quantity.
A leftward shift in supply (decrease) raises equilibrium price and lowers equilibrium quantity.
Market diagrams illustrate these changes.
Related Markets
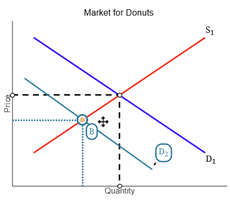
A shock in one market (e.g., coffee) can affect related markets (e.g., donuts, if coffee and donuts are complements).
A decrease in coffee supply may reduce demand for donuts, shifting the donut demand curve leftward, lowering both equilibrium price and quantity for donuts.
Real vs. Nominal Changes
Definitions
Nominal GDP: The total value of goods and services produced in an economy, measured using current prices during the year of production.
Real GDP: The total value of goods and services produced, measured using prices from a base year to remove the effects of inflation.
Calculating Real and Nominal GDP
Nominal GDP can increase due to higher production or higher prices.
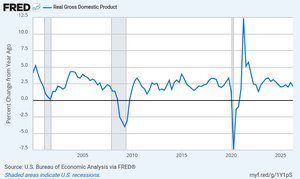
Real GDP isolates changes in production by holding prices constant.
Growth rates can be calculated for both nominal and real GDP to analyze economic performance.
Price Indices and Inflation Measurement
GDP Deflator
The GDP Deflator measures the change in prices for all goods and services included in GDP.
It is calculated as:
Personal Consumption Expenditures (PCE) Price Index
The PCE Price Index tracks prices of goods and services purchased by consumers, including imports.
It uses a "chain-weighted" method, adjusting weights as consumption patterns change.
Released monthly by the Bureau of Economic Analysis (BEA).
Consumer Price Index (CPI)
The CPI measures the average change in prices paid by consumers for a fixed basket of goods and services.
It is simpler than PCE, as weights do not change with consumption patterns.
Released monthly by the Bureau of Labor Statistics (BLS).
Calculating the Inflation Rate
The inflation rate is the percentage change in a price index from one period to the next:
Inflation can be measured monthly, quarterly, or annually.
Headline vs. Core Inflation
Headline inflation includes all items, including volatile food and energy prices.
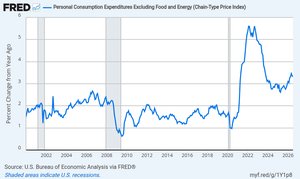
Core inflation excludes food and energy, providing a better measure of underlying trends.
Both CPI and PCE have headline and core versions.
Comparing Price Indices
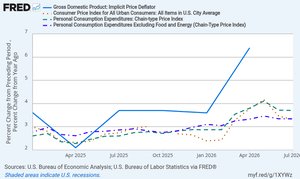
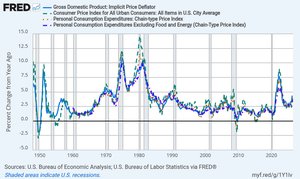
GDP Deflator, CPI, and PCE often move together but have important differences due to coverage and weighting.
Core PCE Over Time
The Federal Reserve often targets the Core PCE inflation rate, aiming for around 2% as a sign of price stability.
Adjusting for Inflation
Comparing Dollar Values Across Time
To compare monetary values from different years, adjust for inflation using a price index:
This allows meaningful comparisons of wages, incomes, or prices over time.
Real Wages and Incomes
Real wages and incomes are adjusted for inflation to reflect true purchasing power.
Tracking real median family income over time shows changes in living standards.
Producer Price Index (PPI)
Definition and Uses
The Producer Price Index (PPI) measures average changes in prices received by domestic producers for their output.
Different versions track prices at various stages of production (final demand, intermediate demand).
PPI can serve as an early warning signal for future consumer price inflation.
Future Topics in Macroeconomics
Monetary Policy and Inflation Targeting
The Federal Reserve targets a 2% Core PCE inflation rate to maintain price stability and support economic growth.
Real GDP and Business Cycles
Real GDP growth rates are used to analyze business cycles—periods of expansion and contraction in economic activity.
Summary Table: Key Price Indices
Index | Covers | Weights | Released By | Frequency |
|---|---|---|---|---|
GDP Deflator | All goods & services in GDP | Current production | BEA | Quarterly |
PCE | Consumer goods & services (incl. imports) | Chain-weighted | BEA | Monthly |
CPI | Consumer goods & services (fixed basket) | Fixed | BLS | Monthly |
PPI | Producer goods & services | Varies by stage | BLS | Monthly |
Additional info:
Historical inflation rates in the U.S. have varied widely, often influenced by business cycles and supply shocks.
Indexes are essential for making meaningful economic comparisons across time and for policy analysis.
